19.2 Case 1: Order
You can change the order of some “layers” without change to the graphical output.
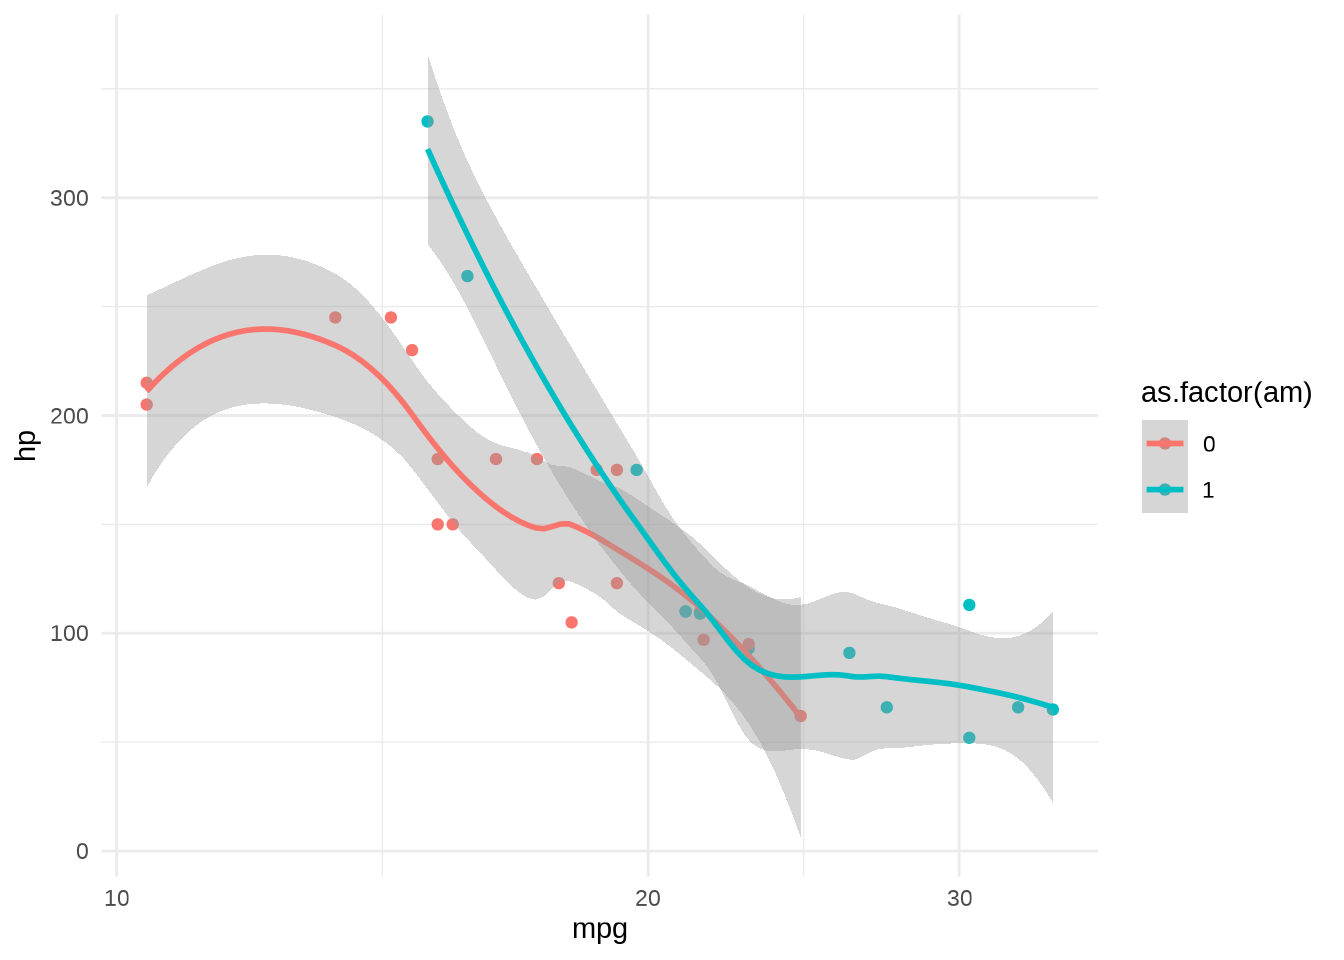
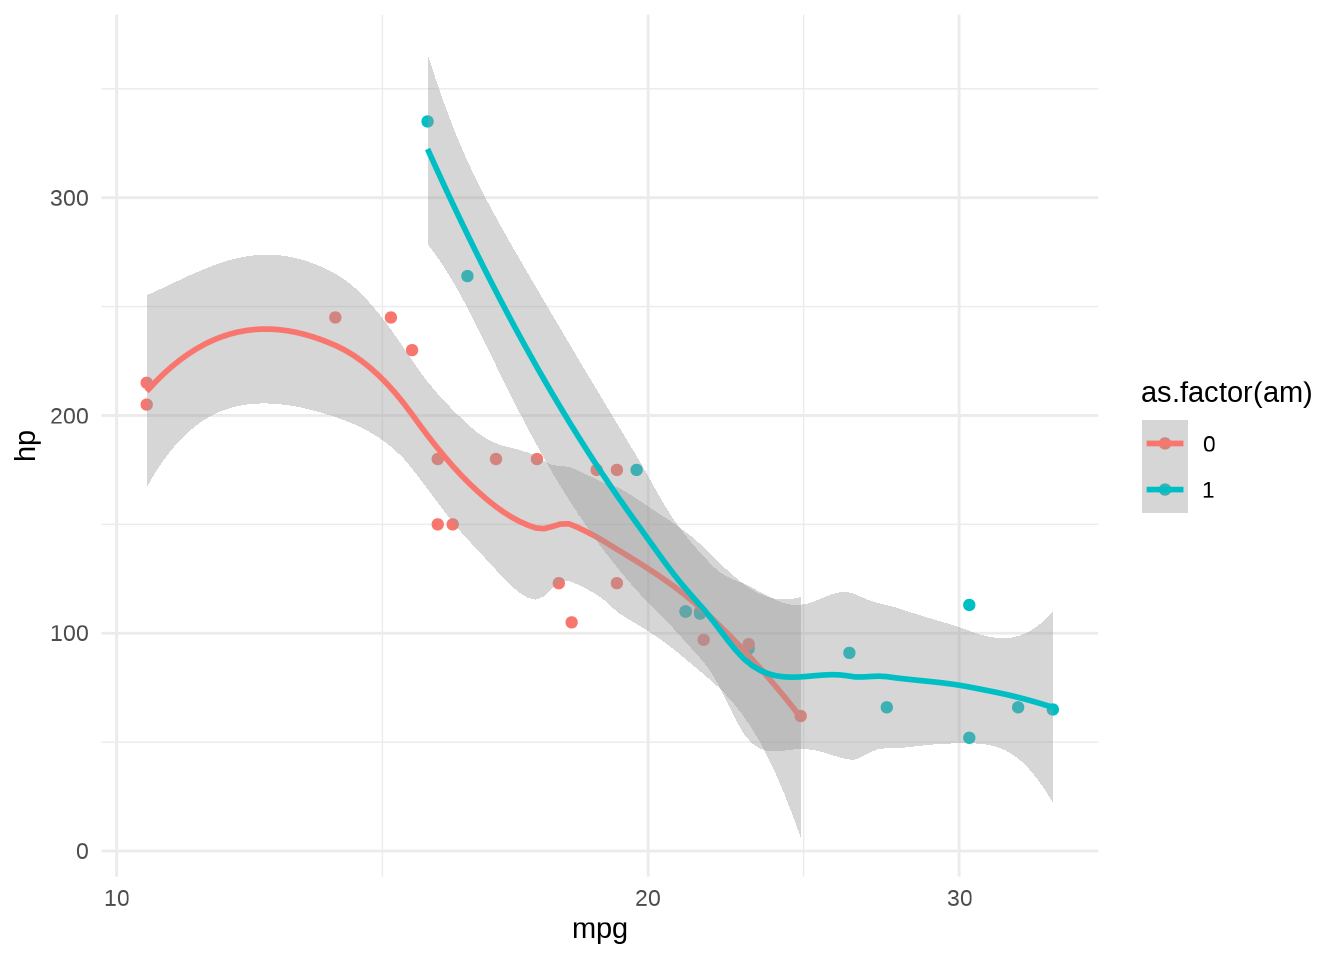
For example, scale_*() can be added anywhere and always ends up applying for the whole plot:
ggplot(mtcars, aes(mpg, hp, color = as.factor(am))) +
  scale_x_log10() + #< scale first
  geom_point() +
  geom_smooth()

ggplot(mtcars, aes(mpg, hp, color = as.factor(am))) +
  geom_point() +
  scale_x_log10() + #< scale middle
  geom_smooth()

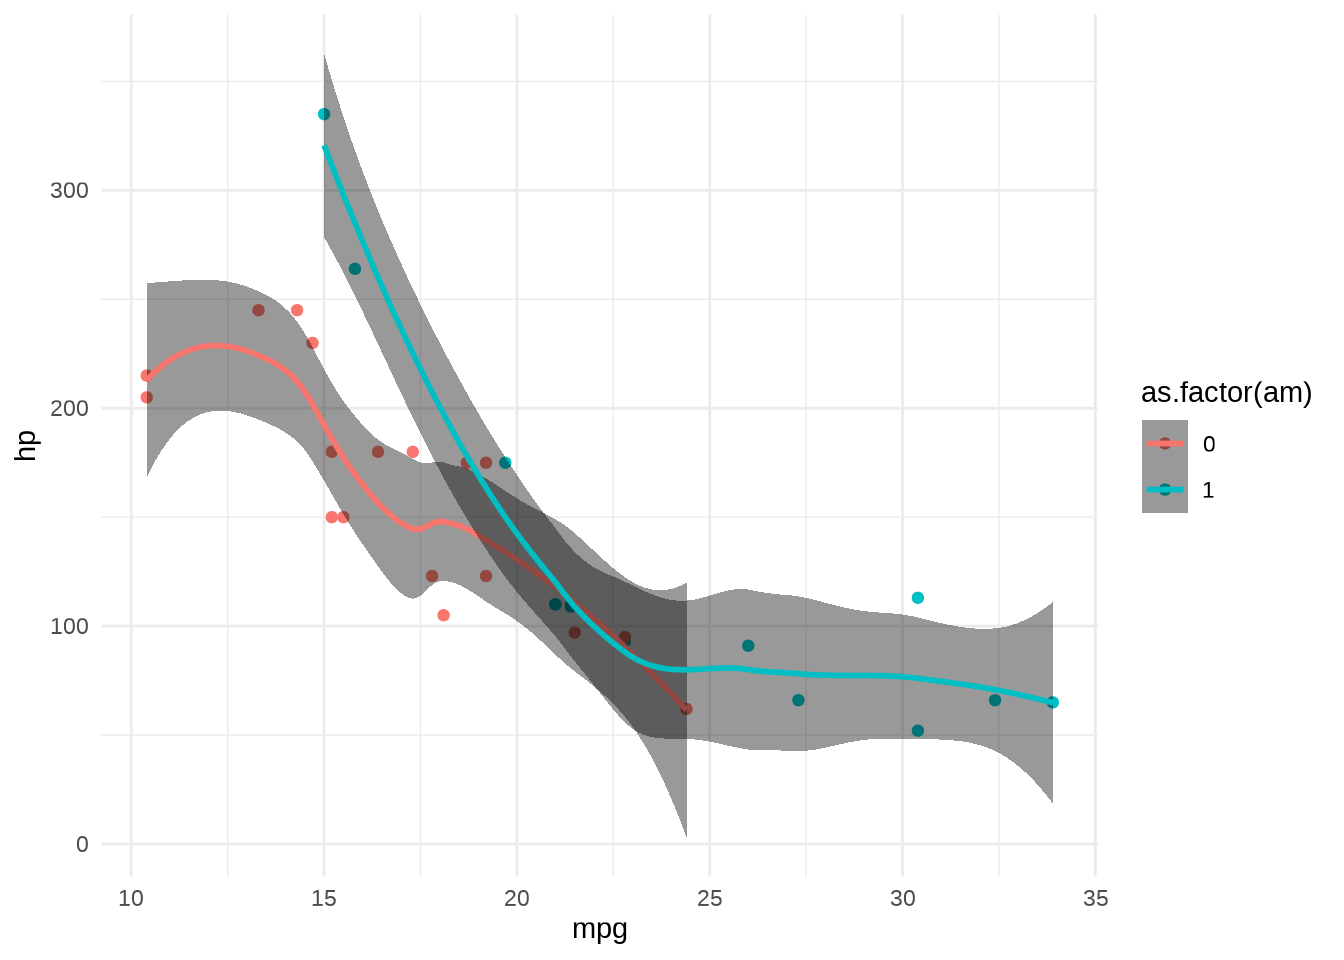
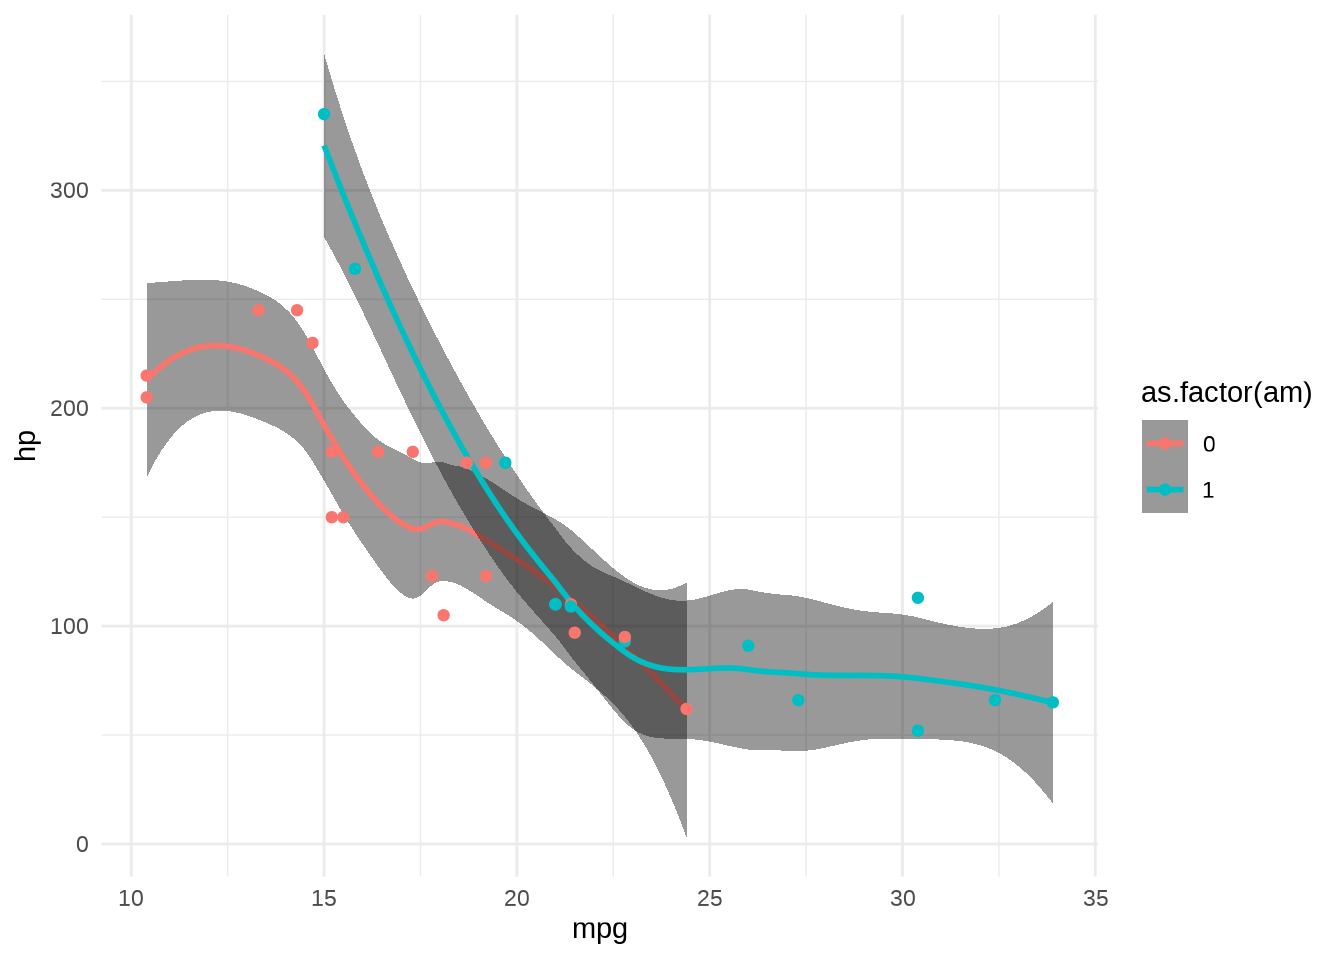
Though the order of geom_*() and stat_*() matters for order of drawing:
ggplot(mtcars, aes(mpg, hp, color = as.factor(am))) +
  geom_point() +
  geom_smooth(fill = "black")

ggplot(mtcars, aes(mpg, hp, color = as.factor(am))) +
  geom_smooth(fill = "black") +
  geom_point()
