12.3 Line type
It is possible to map a variable onto the linetype aesthetic, which works best for discrete variables with a small number of categories, where scale_linetype() is an alias for scale_linetype_discrete(). Continuous variables cannot be mapped to line types unless scale_linetype_binned() is used: although there is a scale_linetype_continuous() function, all it does is produce an error.

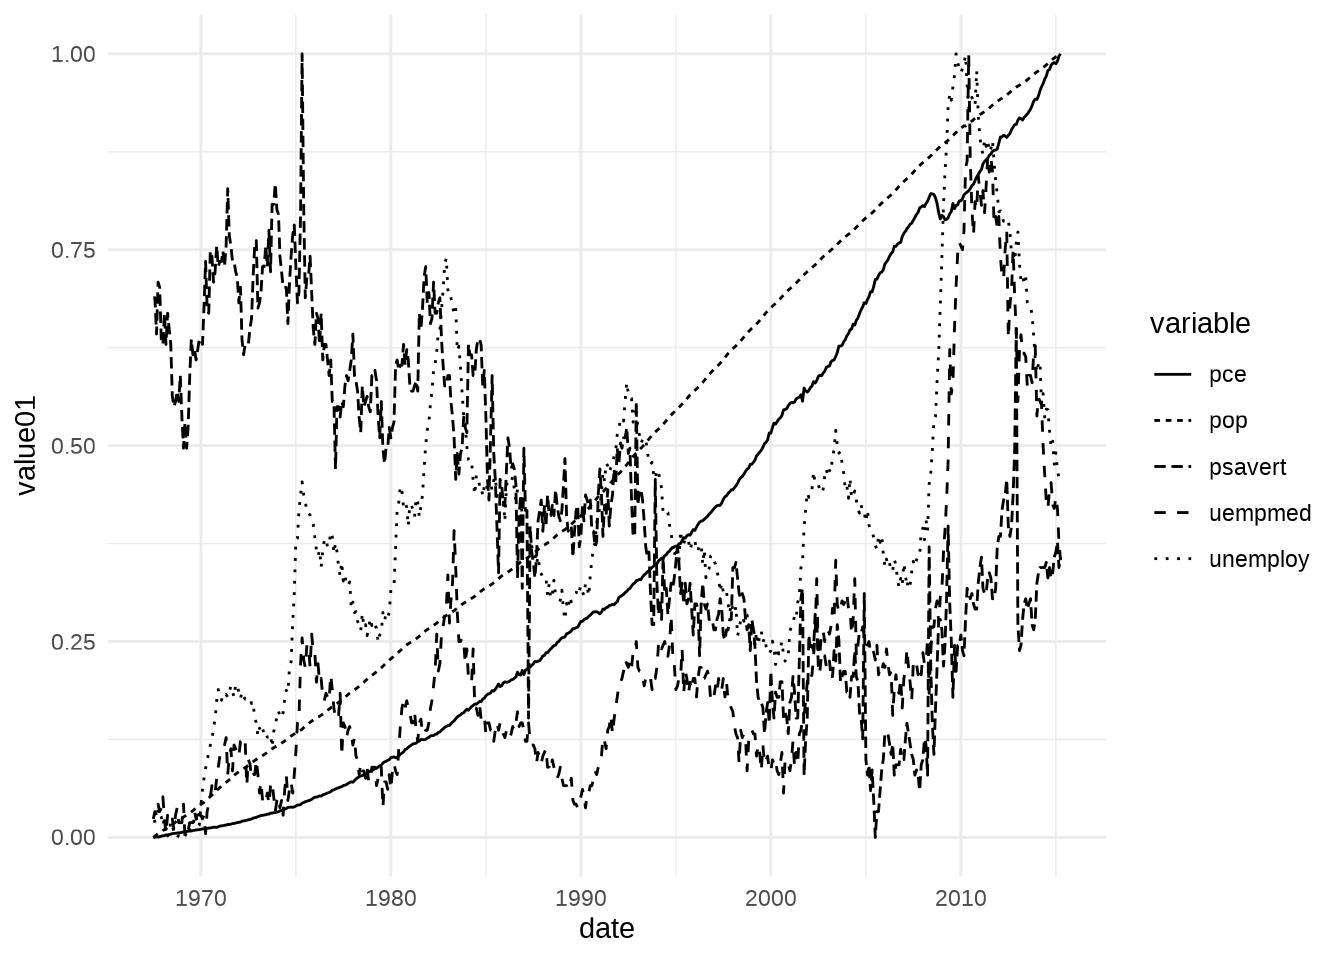
With five categories the above plot is quite difficult to read.
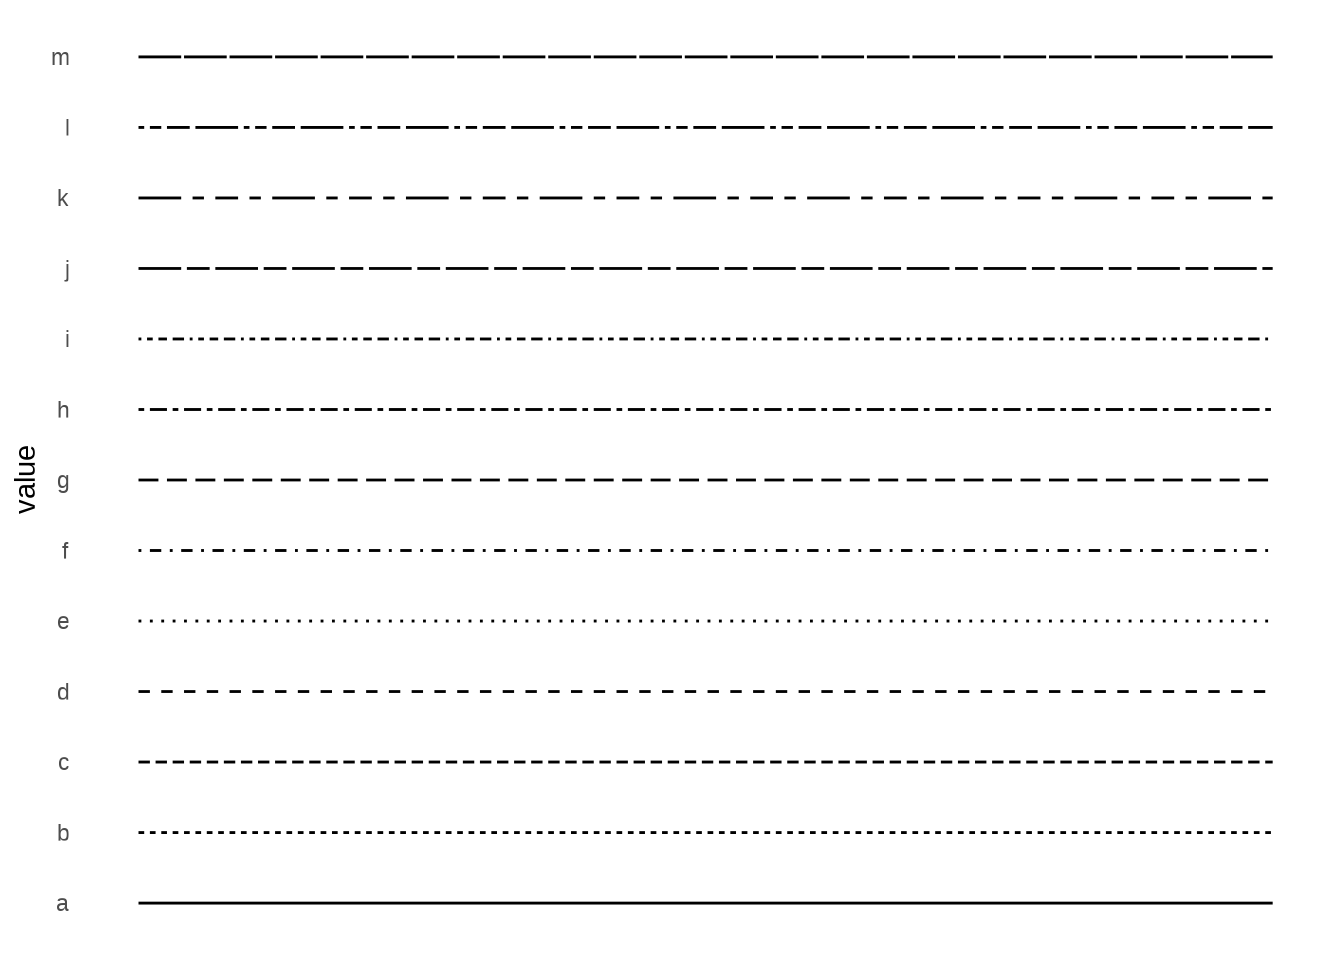
The default “palette” for linetype is supplied by the scales::linetype_pal() function, and includes the 13 linetypes shown below:

You can control the line type by specifying a string with up to 8 hexadecimal values.
In this specification,
-the first value is the length of the first line segment, the second value is the length of the first space between segments, and so on.
This allows you to specify your own line types using scale_linetype_manual(), or alternatively, by passing a custom function to the palette argument.
Note that the last four lines are blank, because the linetypes() function defined above returns NA when the number of categories exceeds 9.
The scale_linetype() function contains a na.value argument used to specify what kind of line is plotted for these values. By default this produces a blank line, but you can override this by setting na.value = “dotted”:
Valid line types can be set using a human readable character string: “blank”, “solid”, “dashed”, “dotted”, “dotdash”, “longdash”, and “twodash” are all understood.