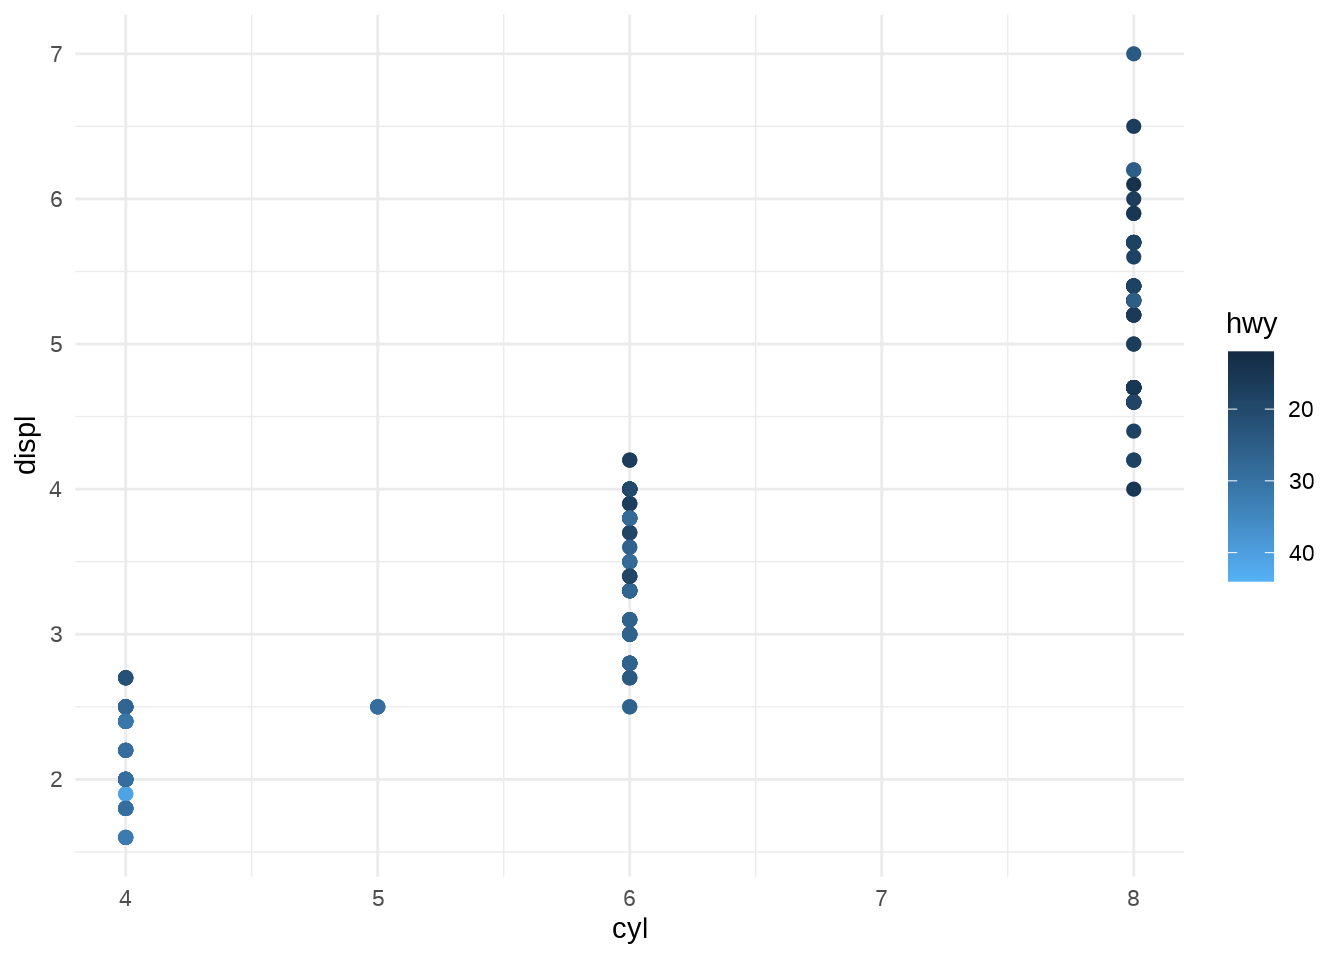
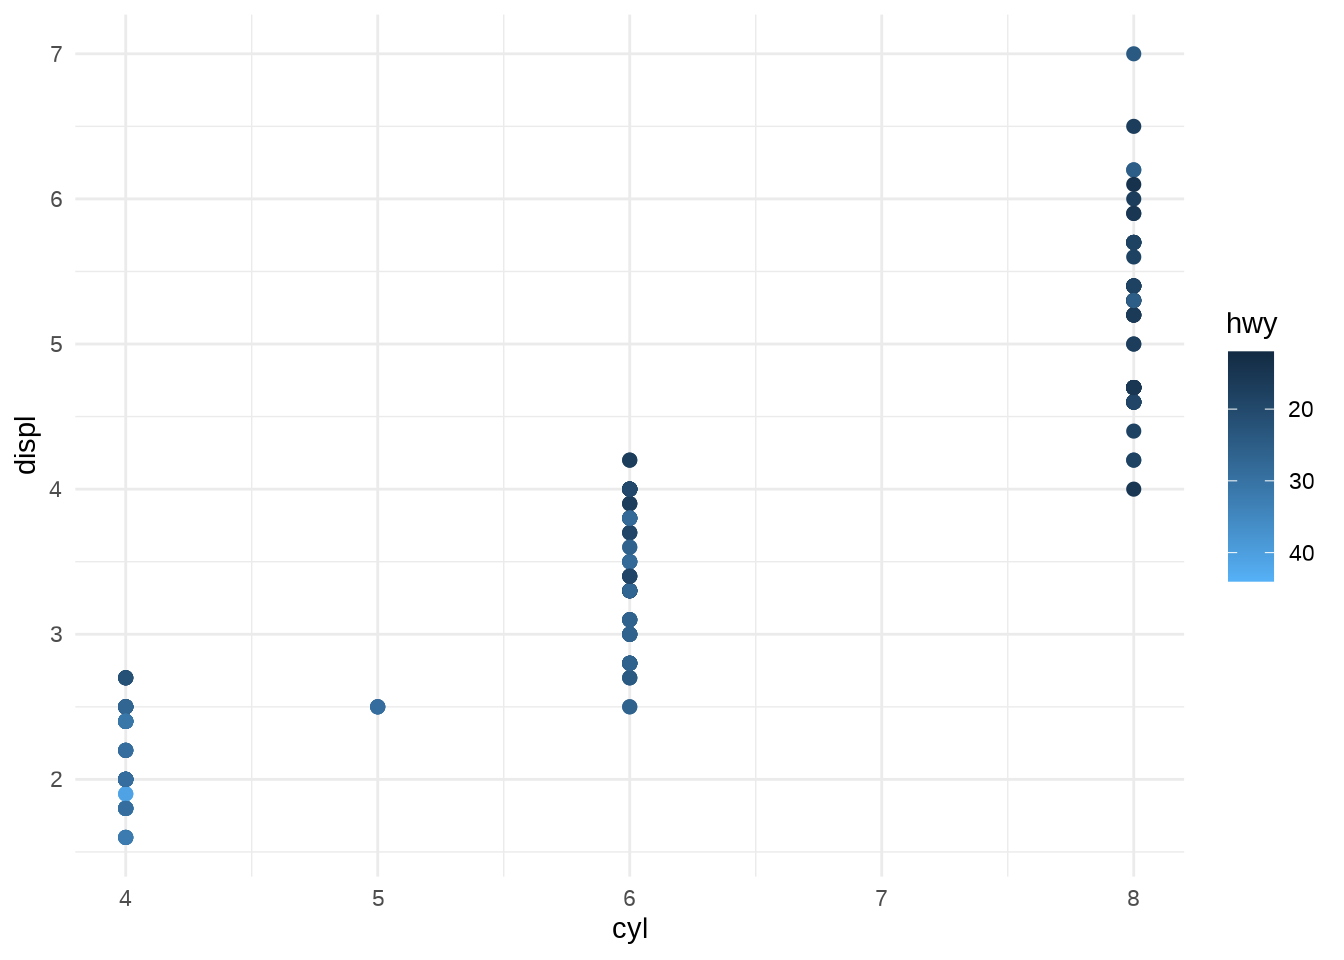
11.2 Continuous colour scales
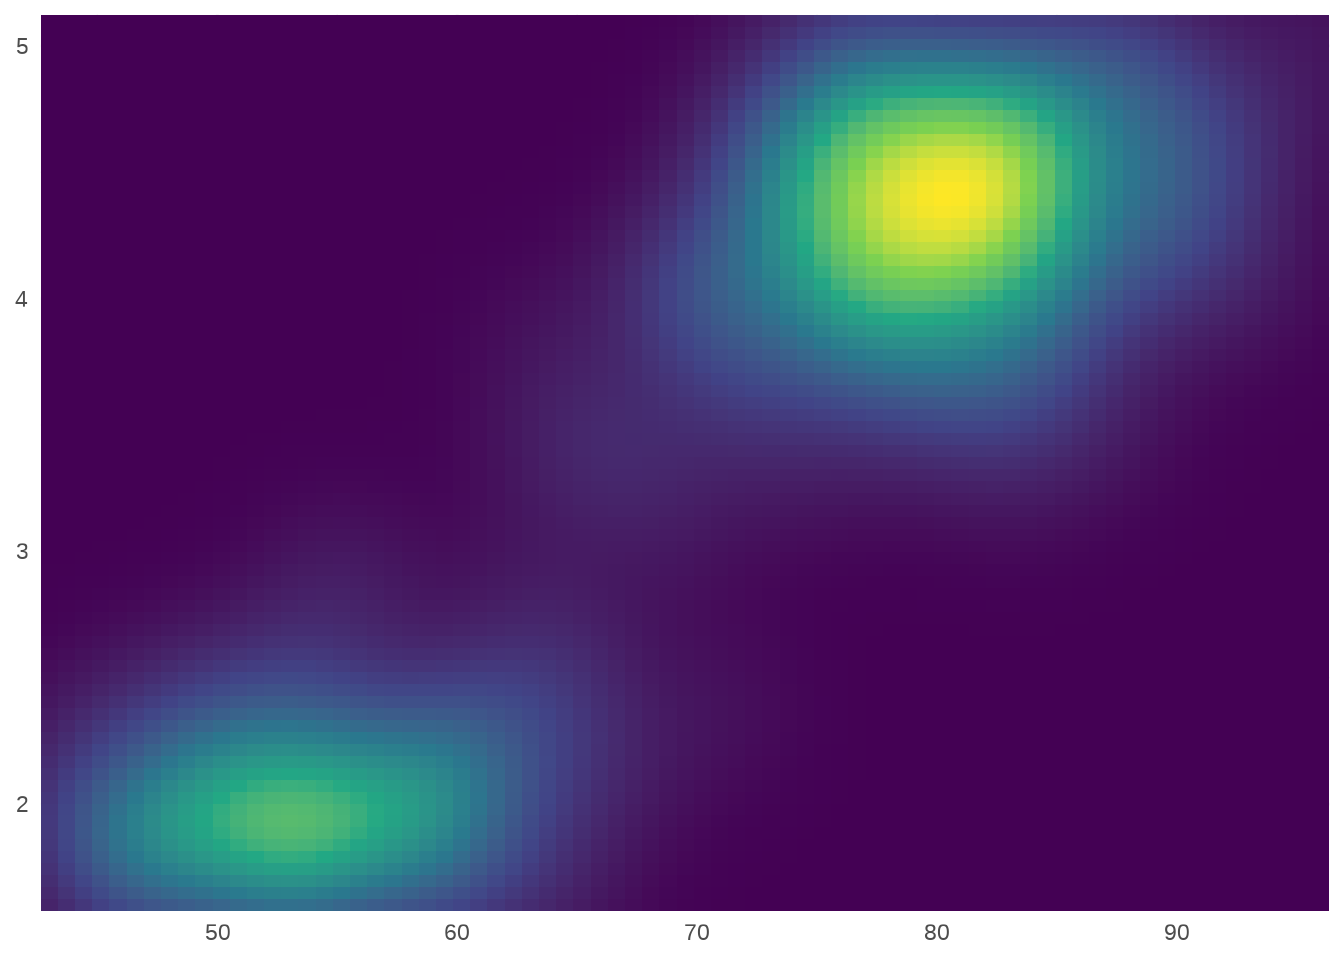
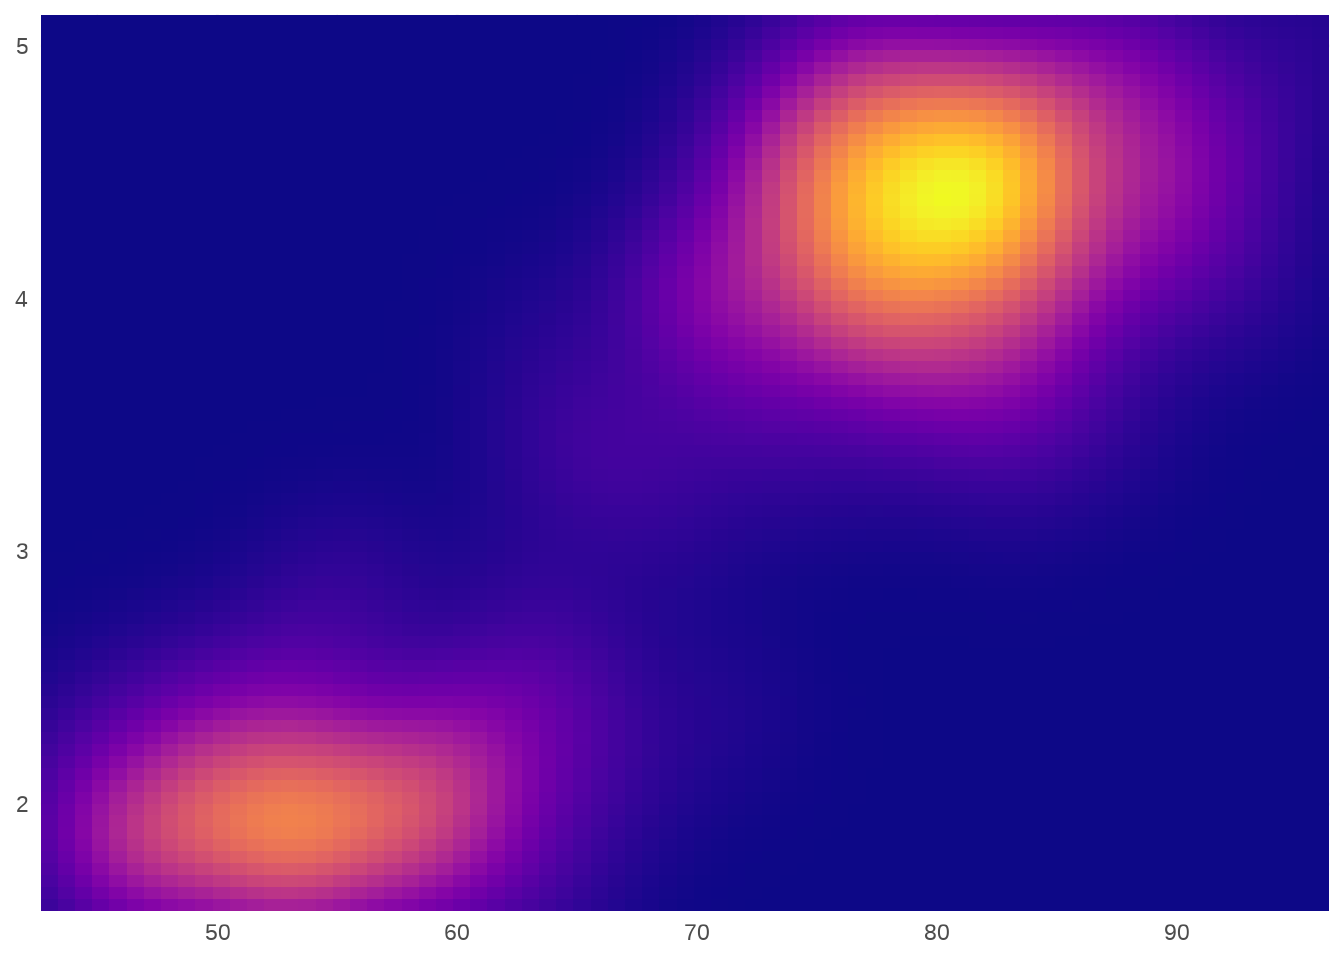
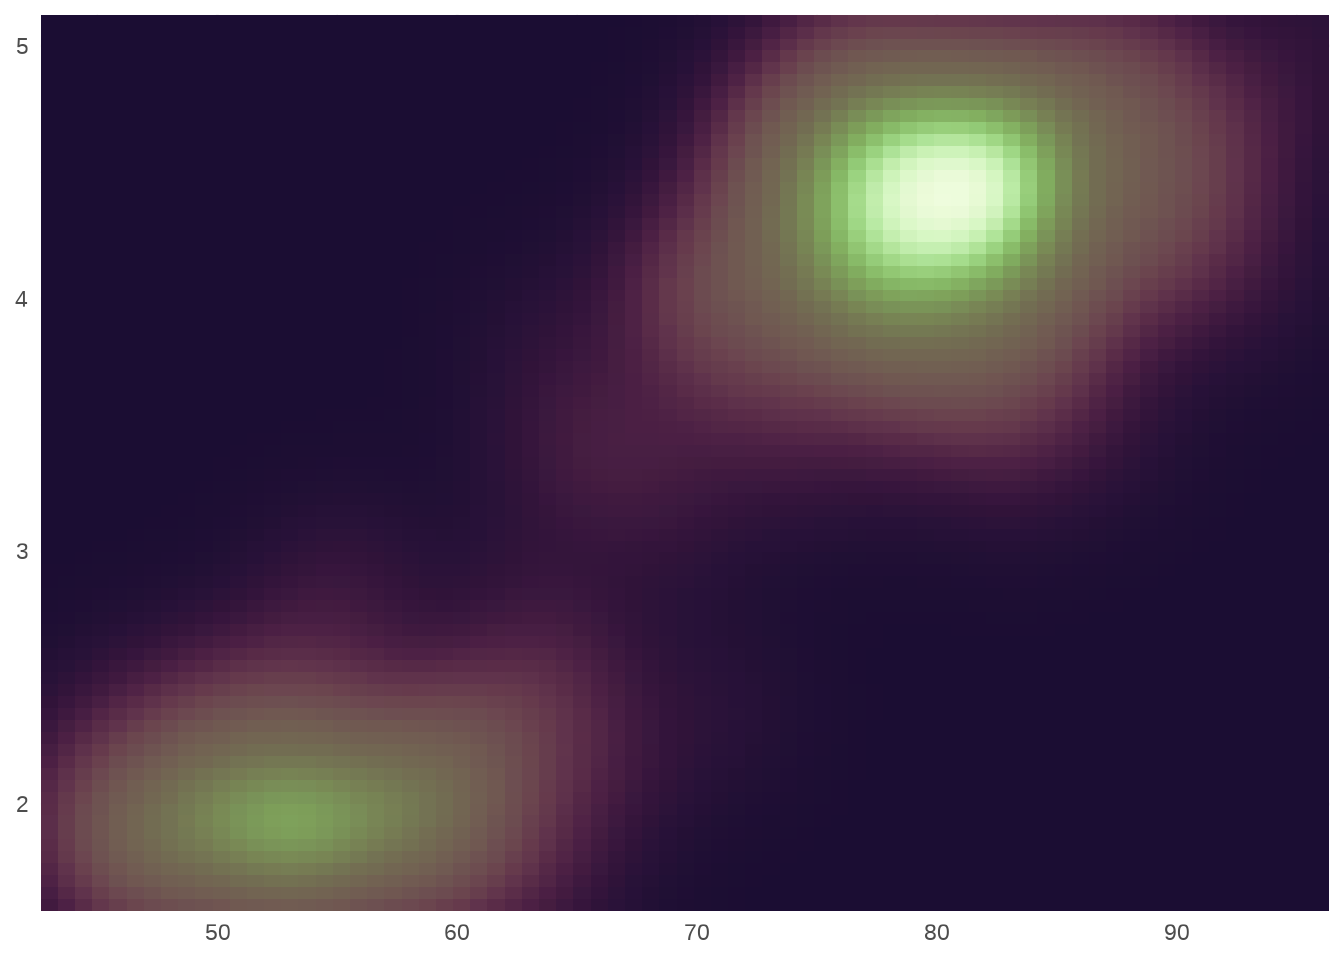
Colour gradients are often used to show the height of a 2d surface. The plots in this section use the surface of a 2d density estimate of the faithful dataset which records the waiting time between eruptions and during each eruption for the Old Faithful geyser in Yellowstone Park.
Any time I refer to scale_fill_() in this section there is a corresponding scale_colour_() for the colour aesthetic (or scale_color_*() if you prefer US spelling).
11.2.1 Particular pallettes
There are multiple ways to specify continuous colour scales. You can use to construct your own palette, but it is unnecessary because there are many “hand picked” palettes available.
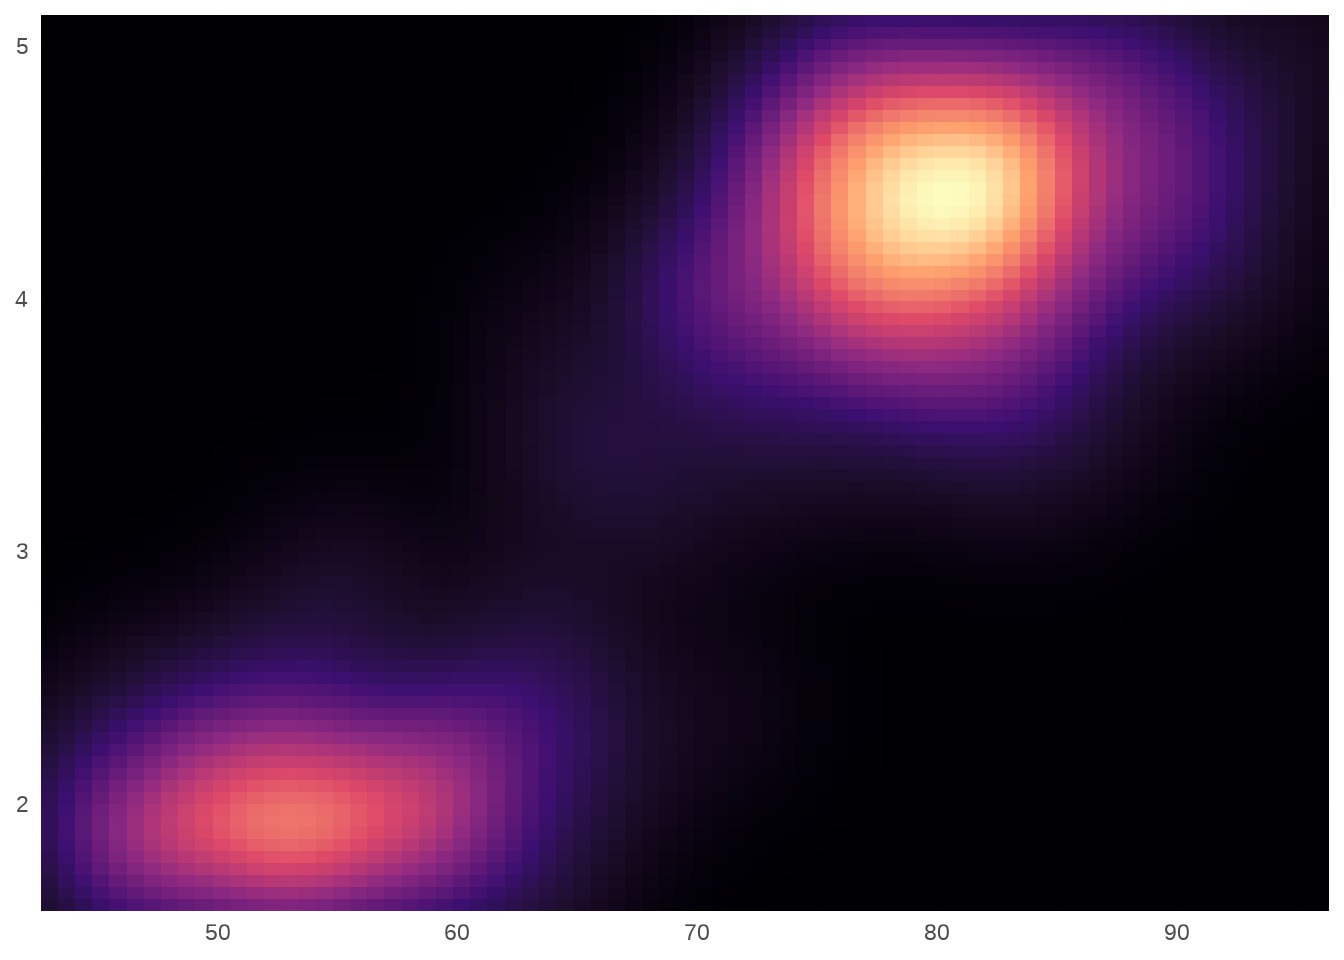
Ggplot2 supplies two scale functions that bundle pre-specified palettes, scale_fill_viridis_c() and scale_fill_distiller(). The viridis scales are designed to be perceptually uniform in both colour and when reduced to black and white, and to be perceptible to people with various forms of colour blindness.
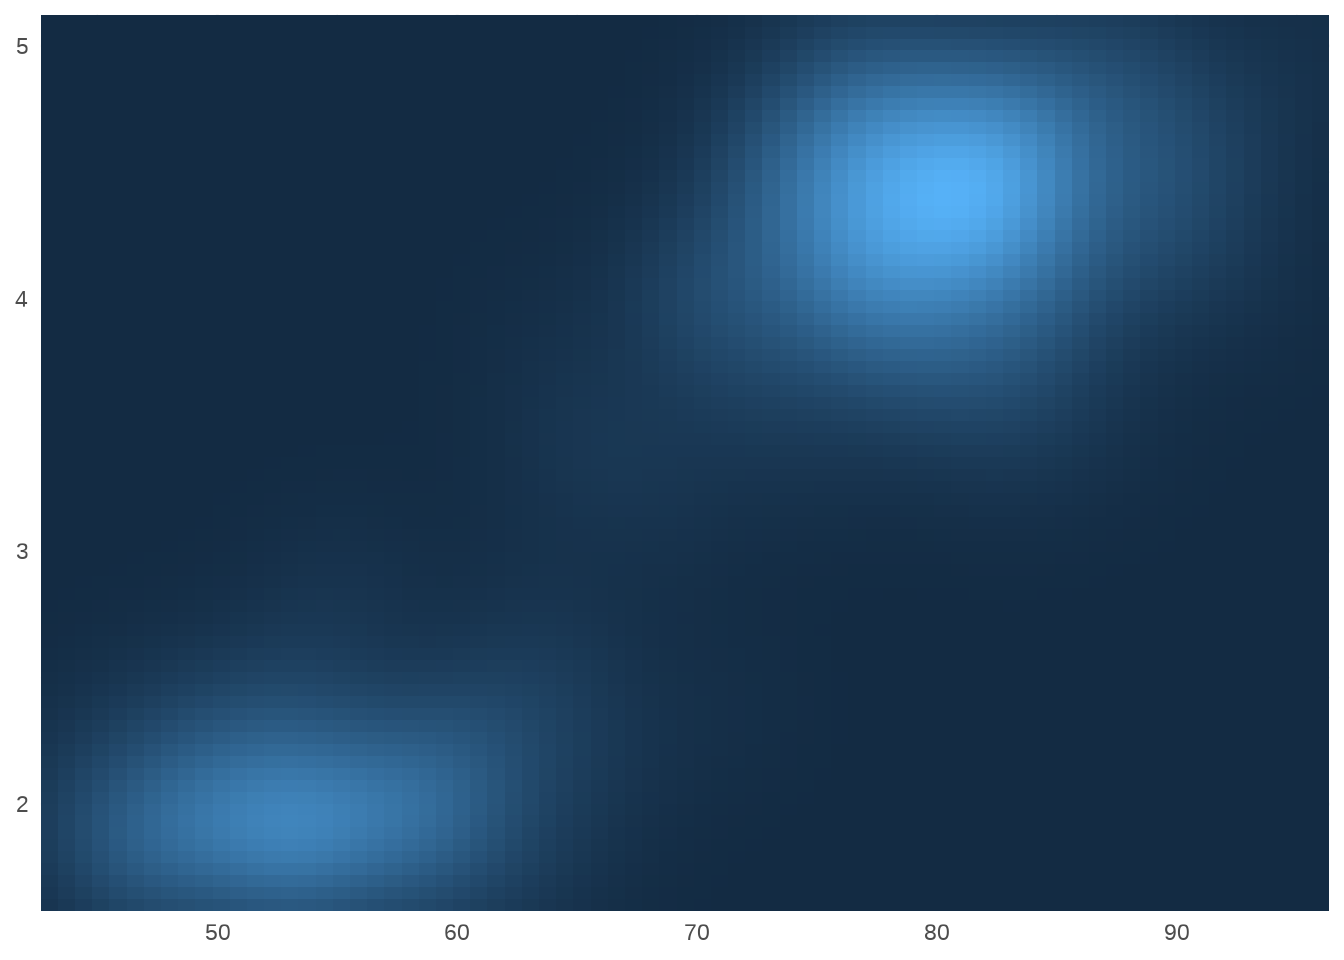
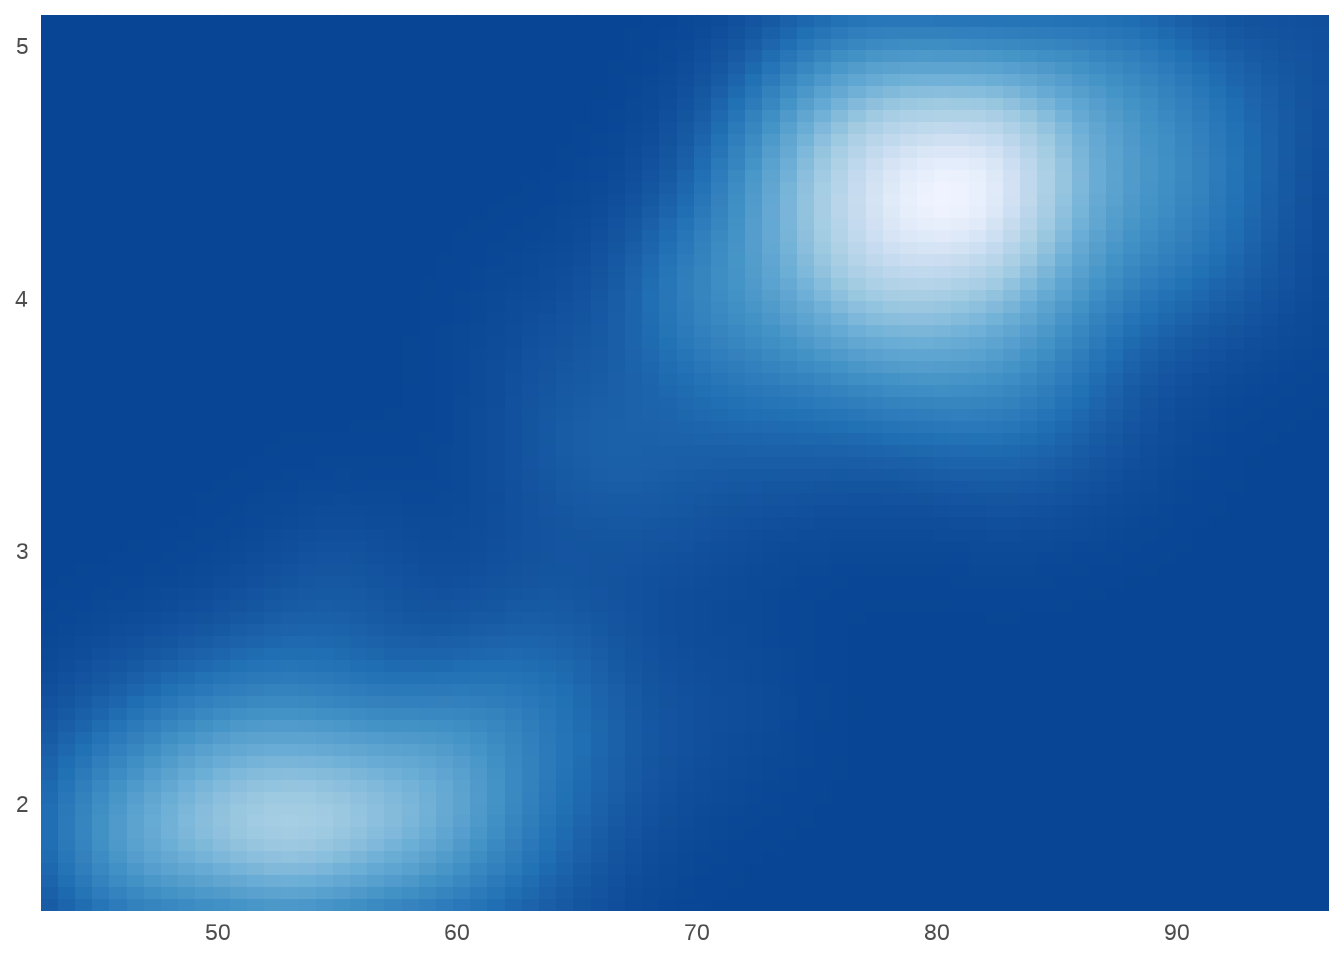
The second group of continuous colour scales built in to ggplot2 are derived from the ColorBrewer scales: scale_fill_brewer() provides these colours as discrete palettes, while scale_fill_distiller() and scale_fill_fermenter() are the continuous and binned analogs.
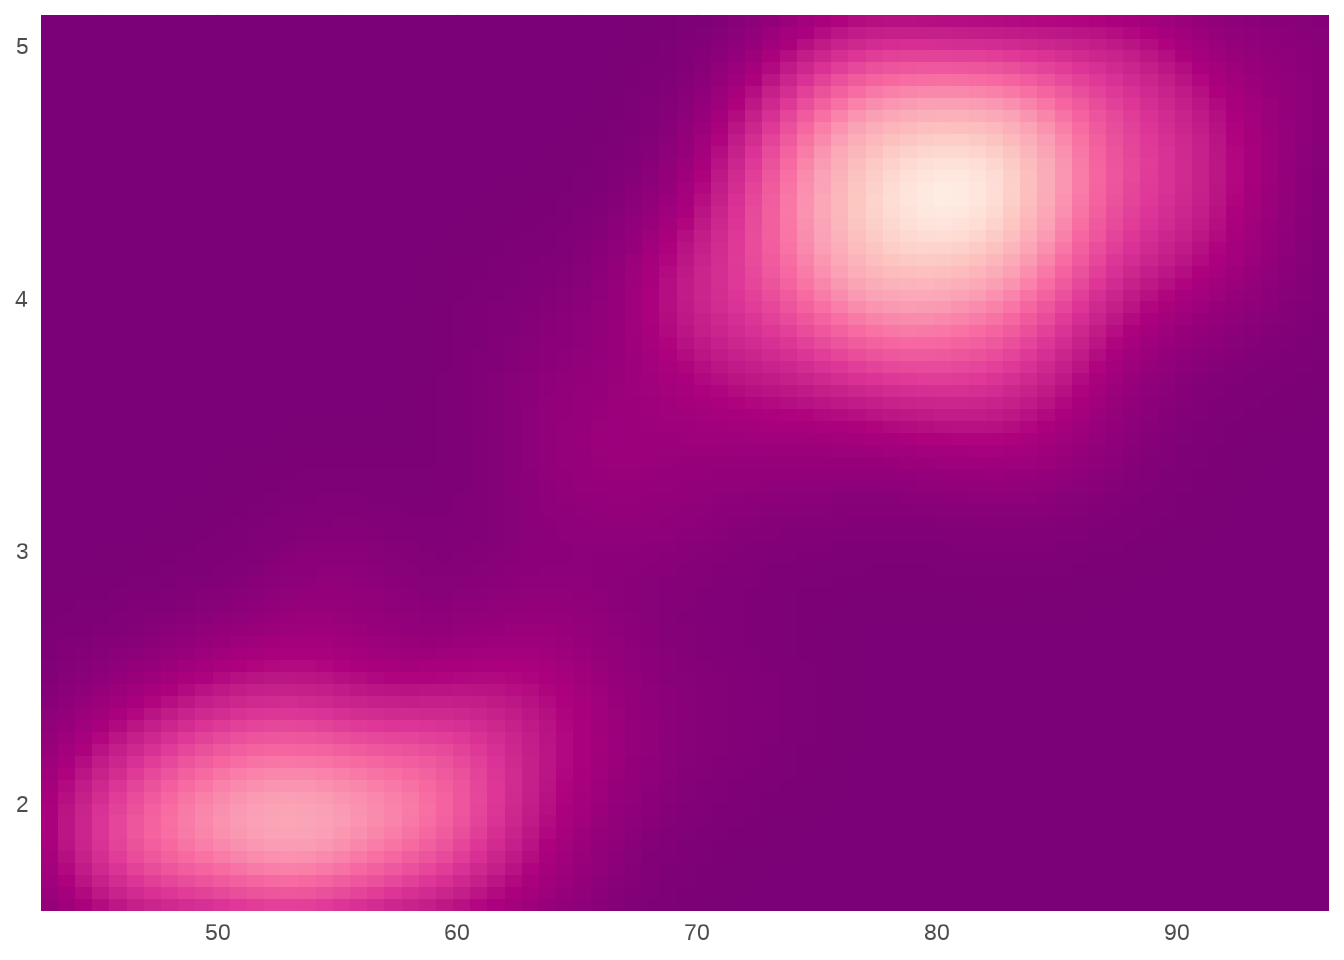
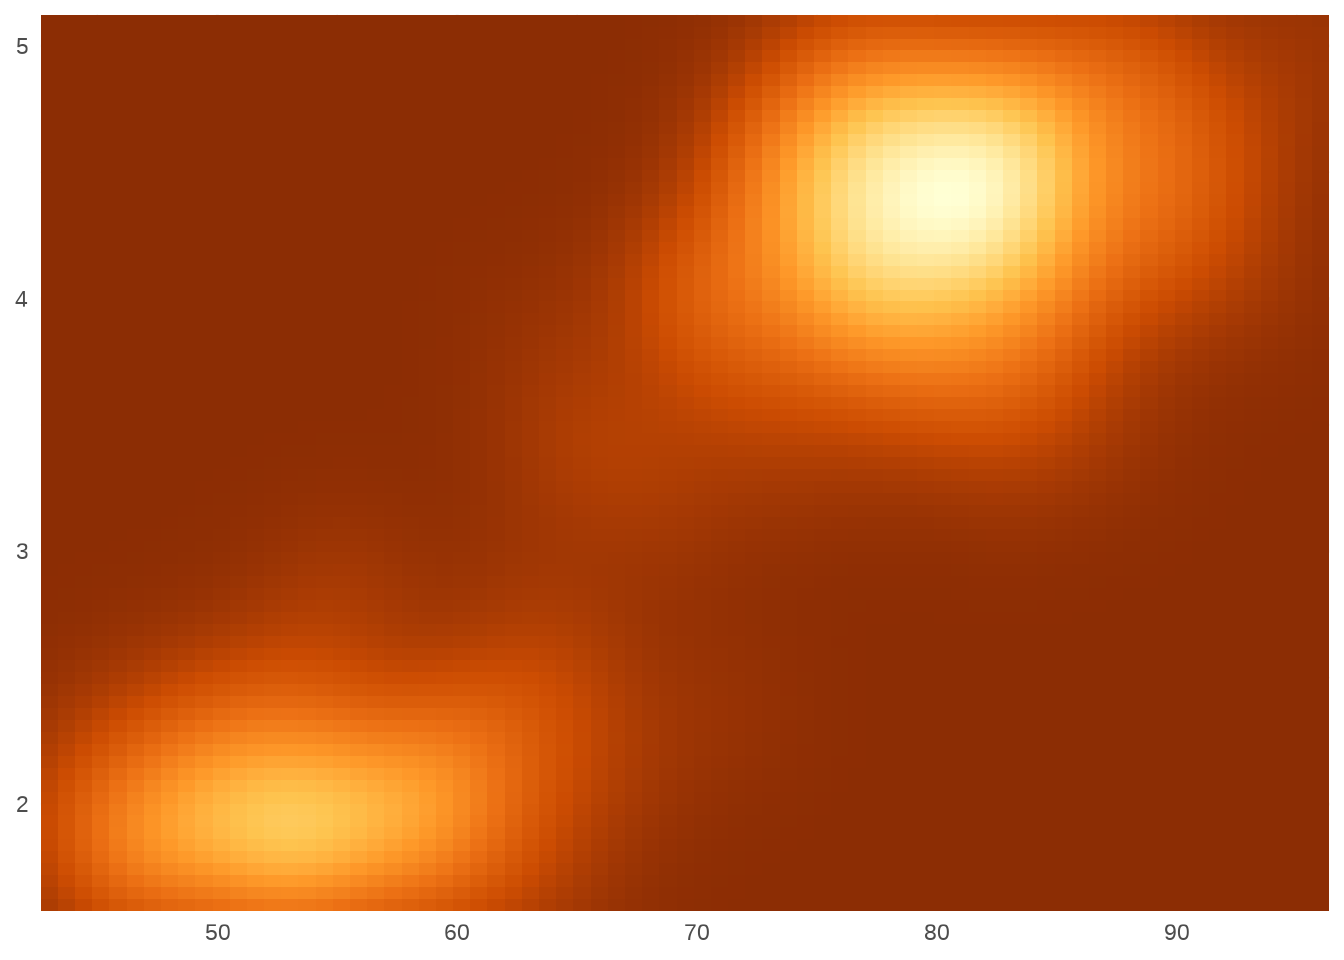
scale_fill_scico() provides palettes that are perceptually uniform and suitable for scientific visualisation
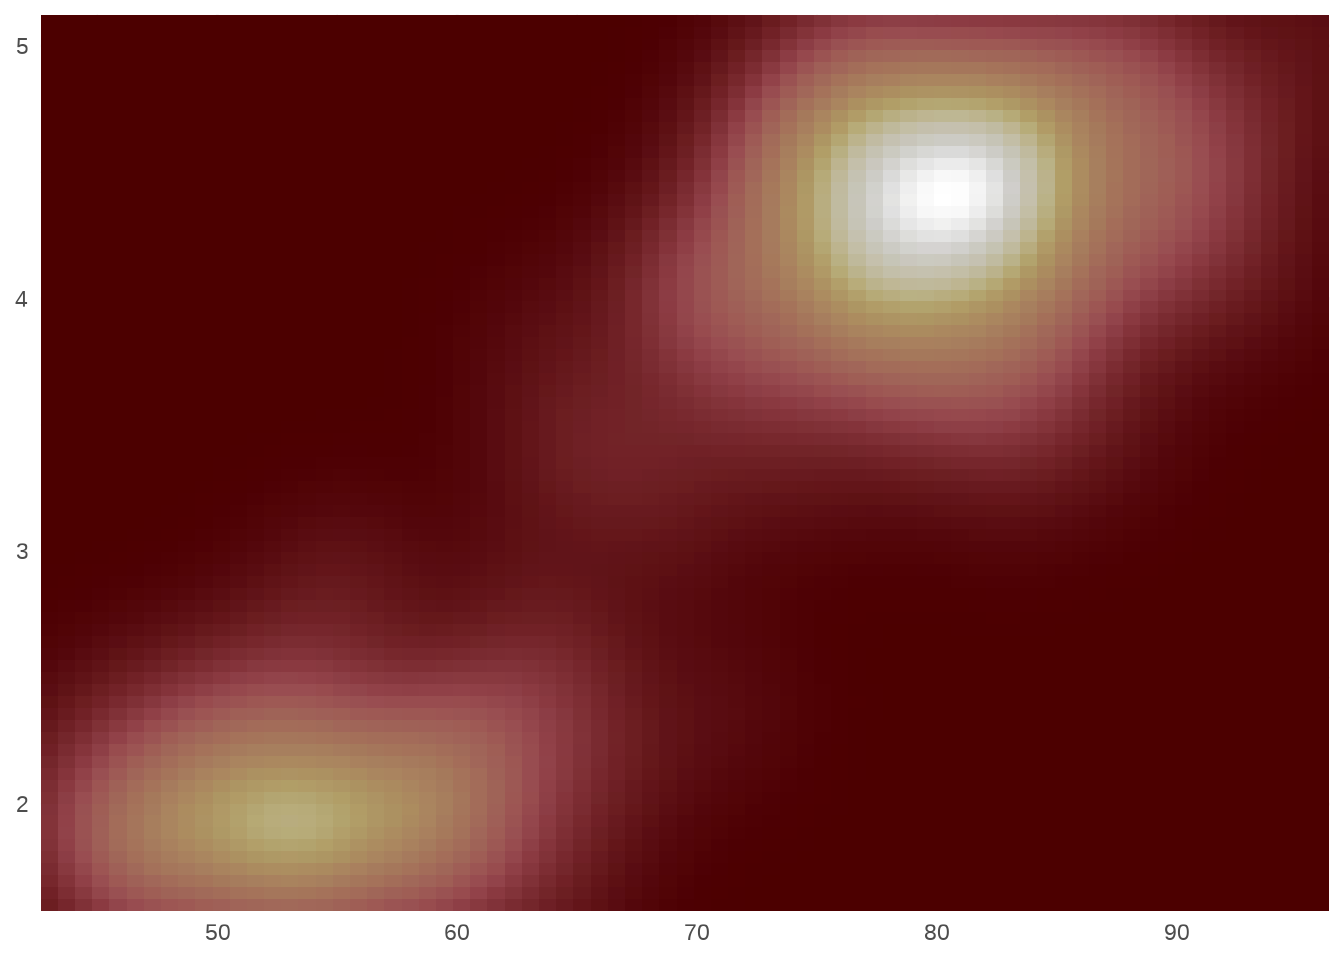
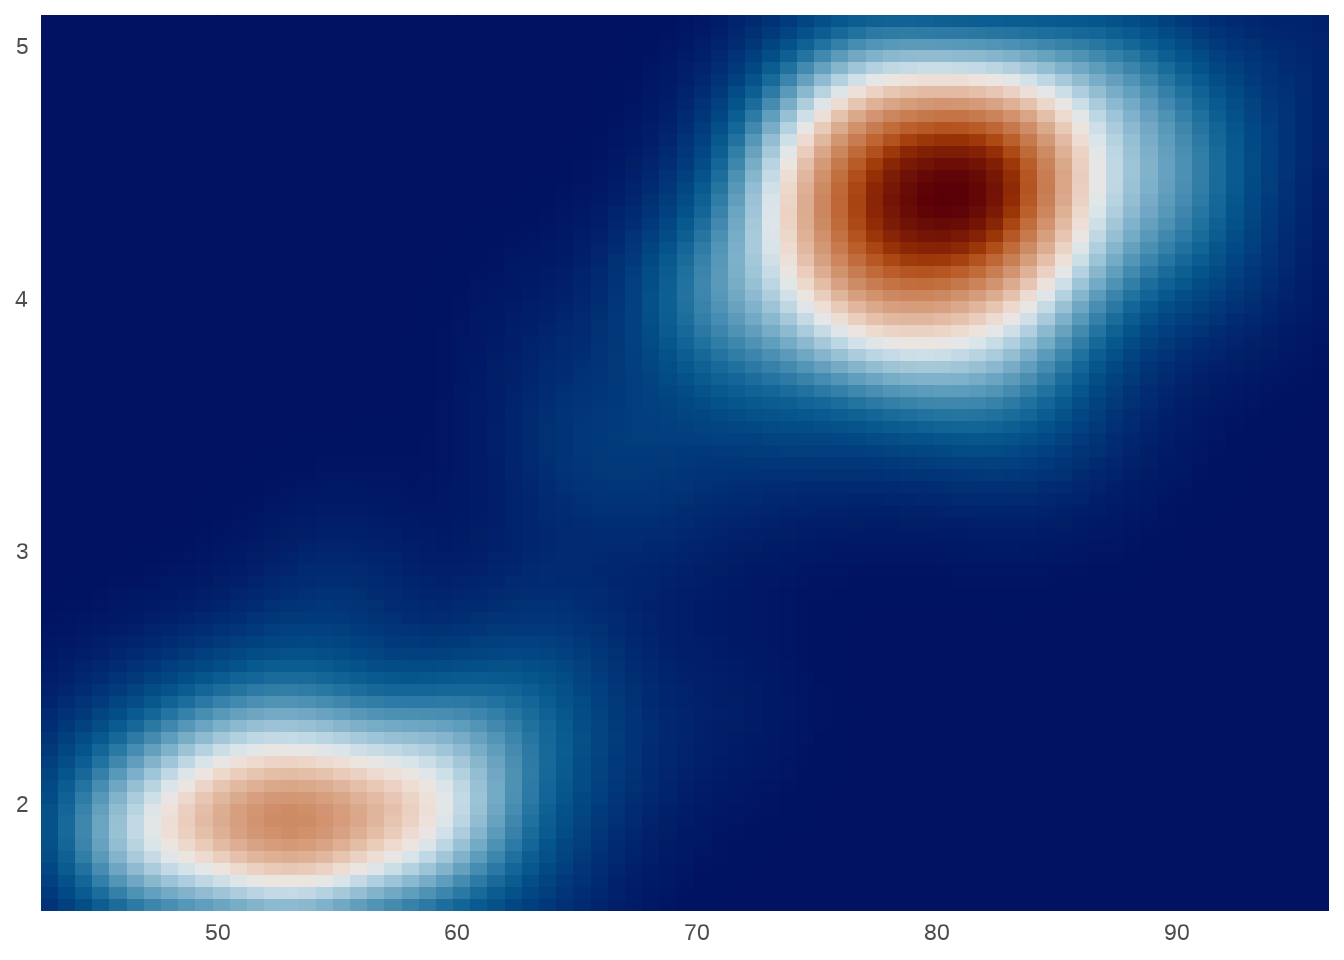
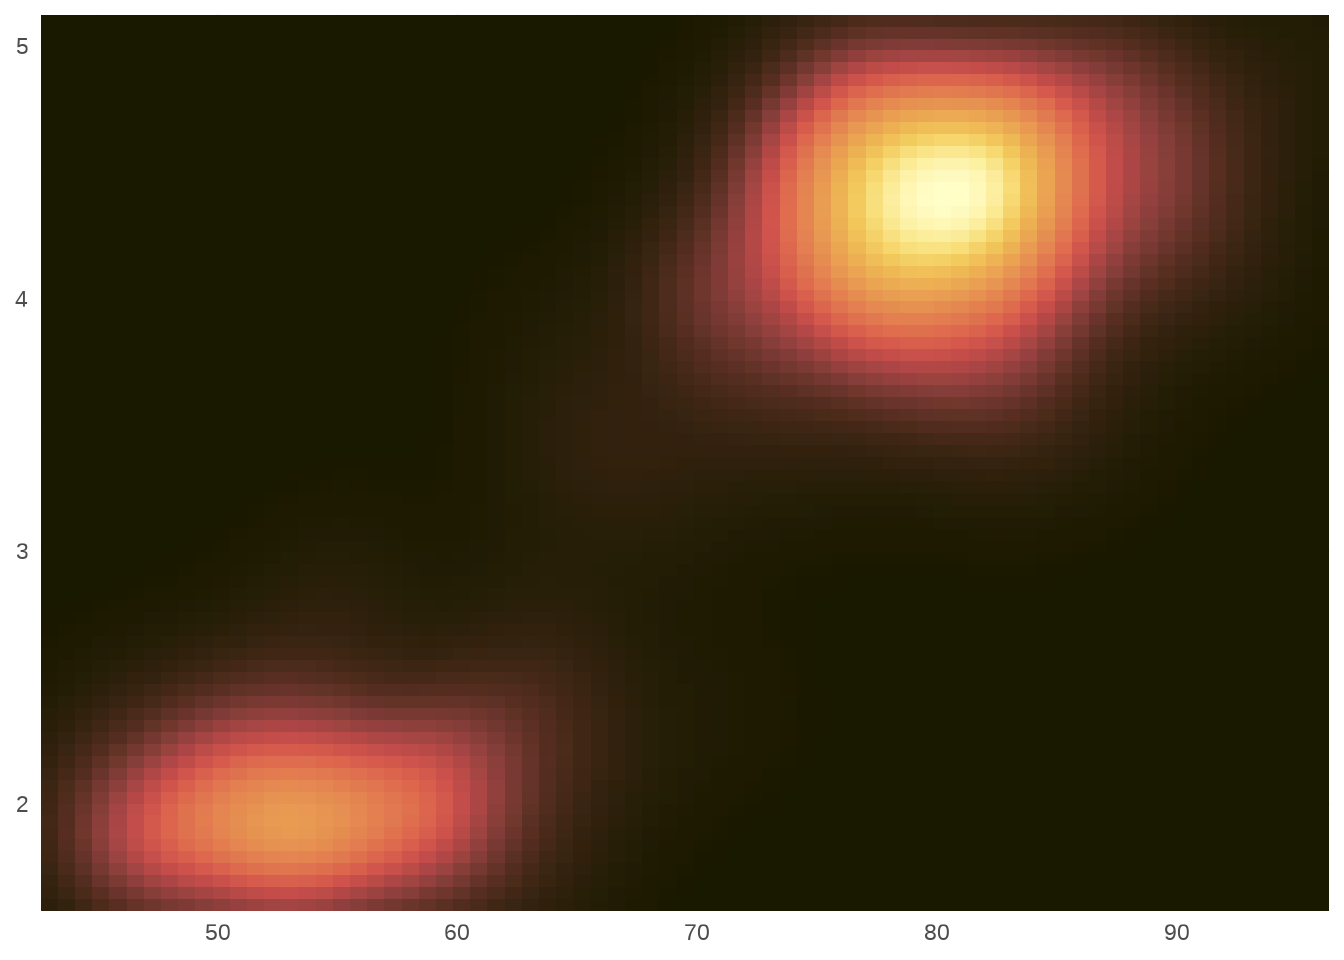
A particularly useful package is paletteer which aims to provide a common interface.
11.2.2 Robust recipes
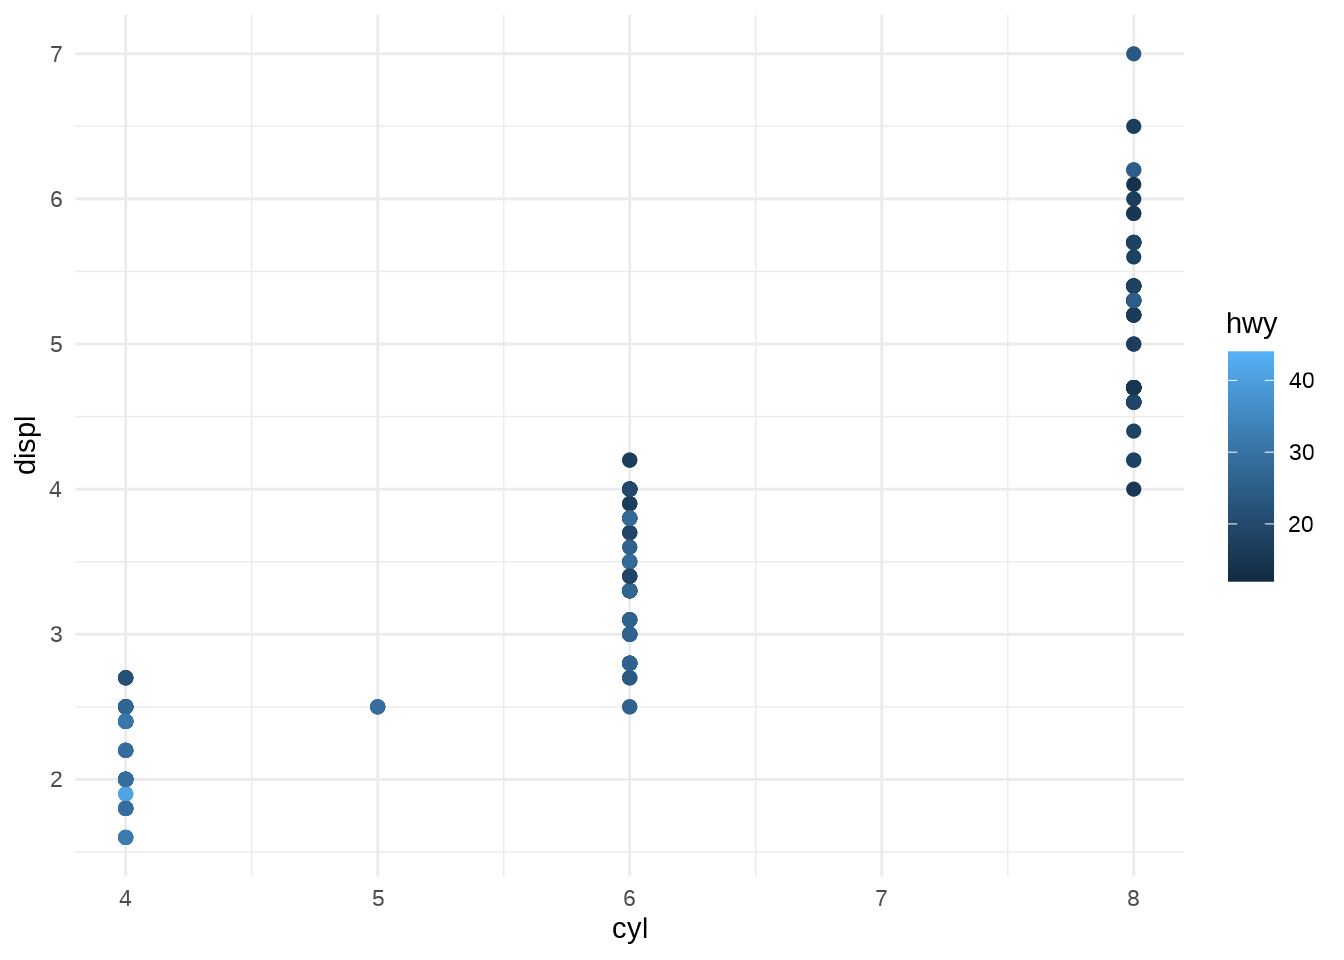
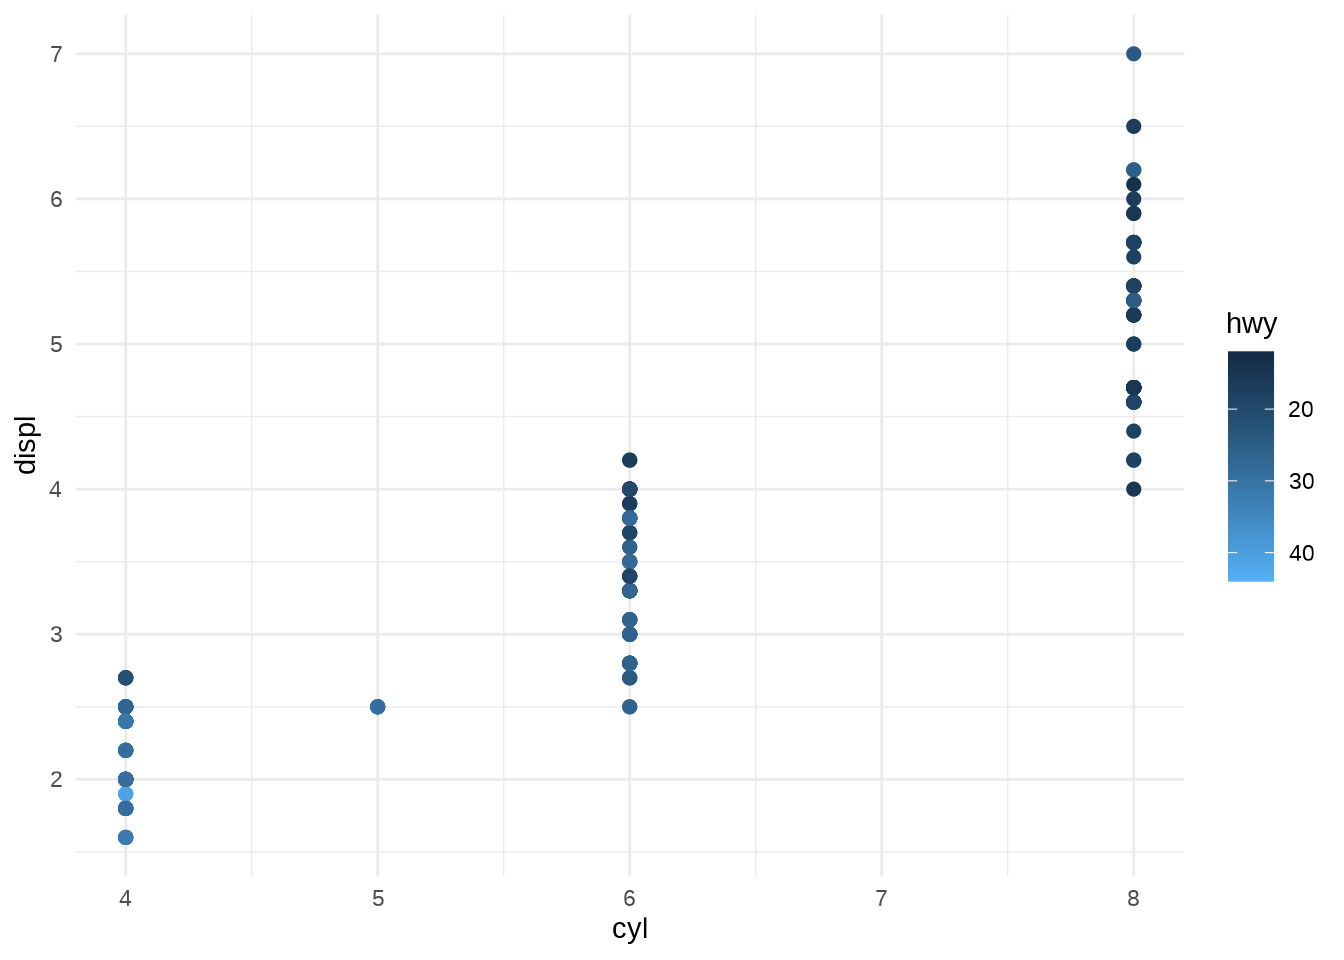
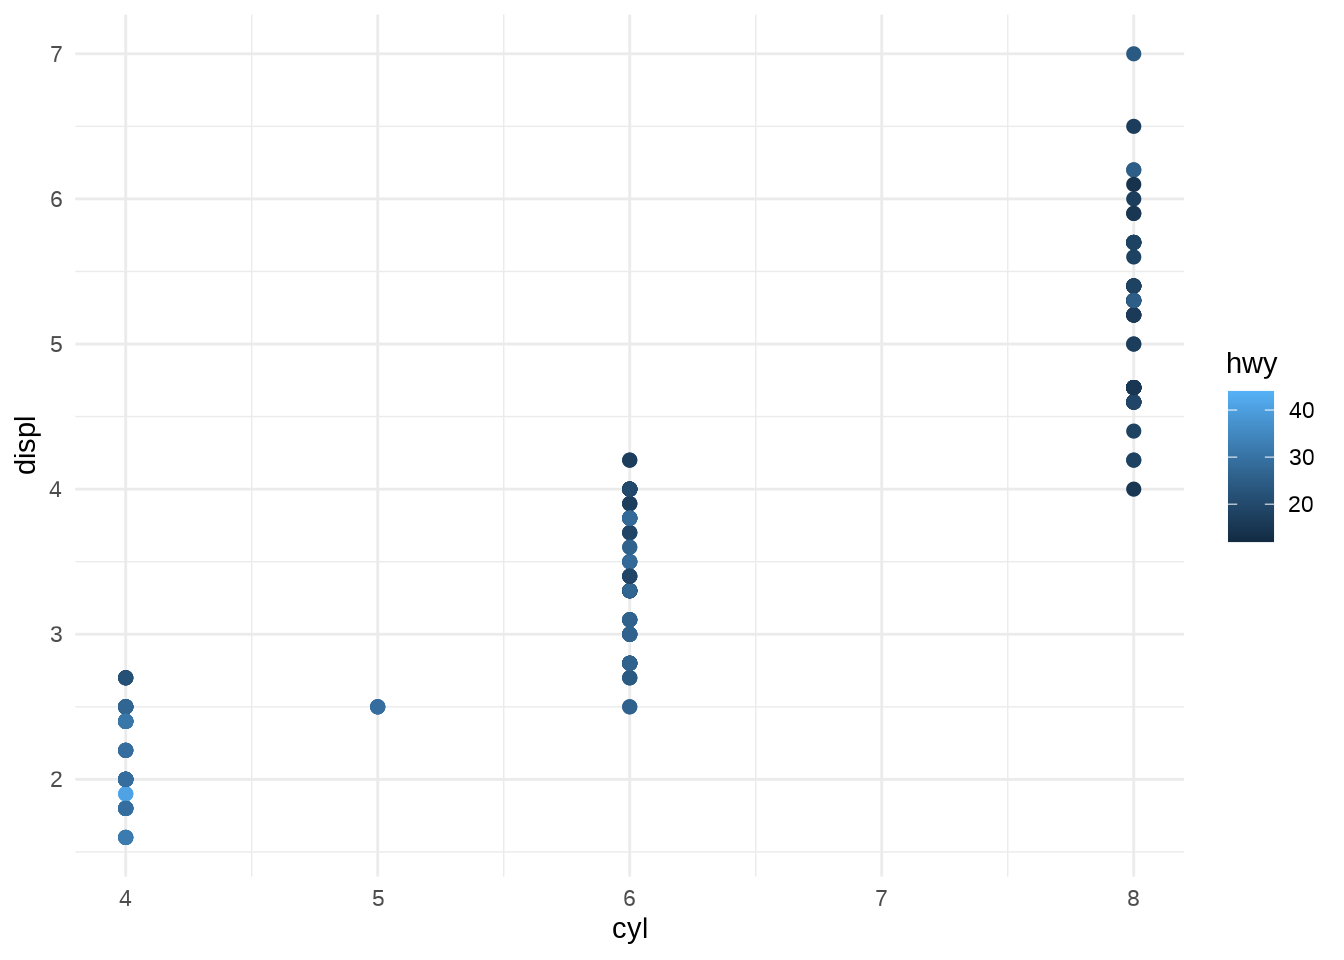
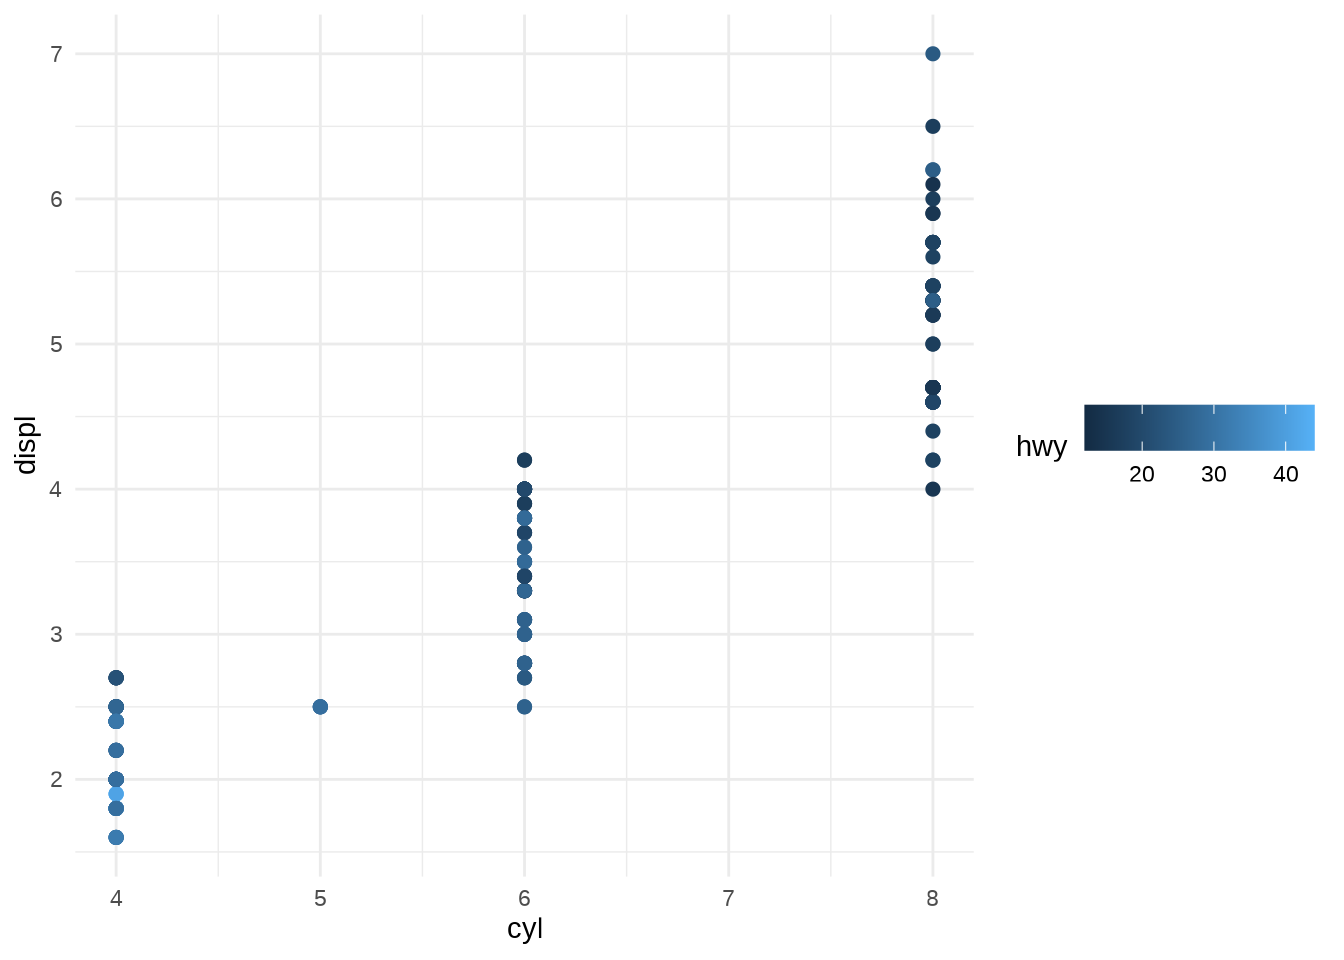
The default scale for continuous fill scales is scale_fill_continuous() which in turn defaults to scale_fill_gradient(). As a consequence, these three commands produce the same plot using a gradient scale.
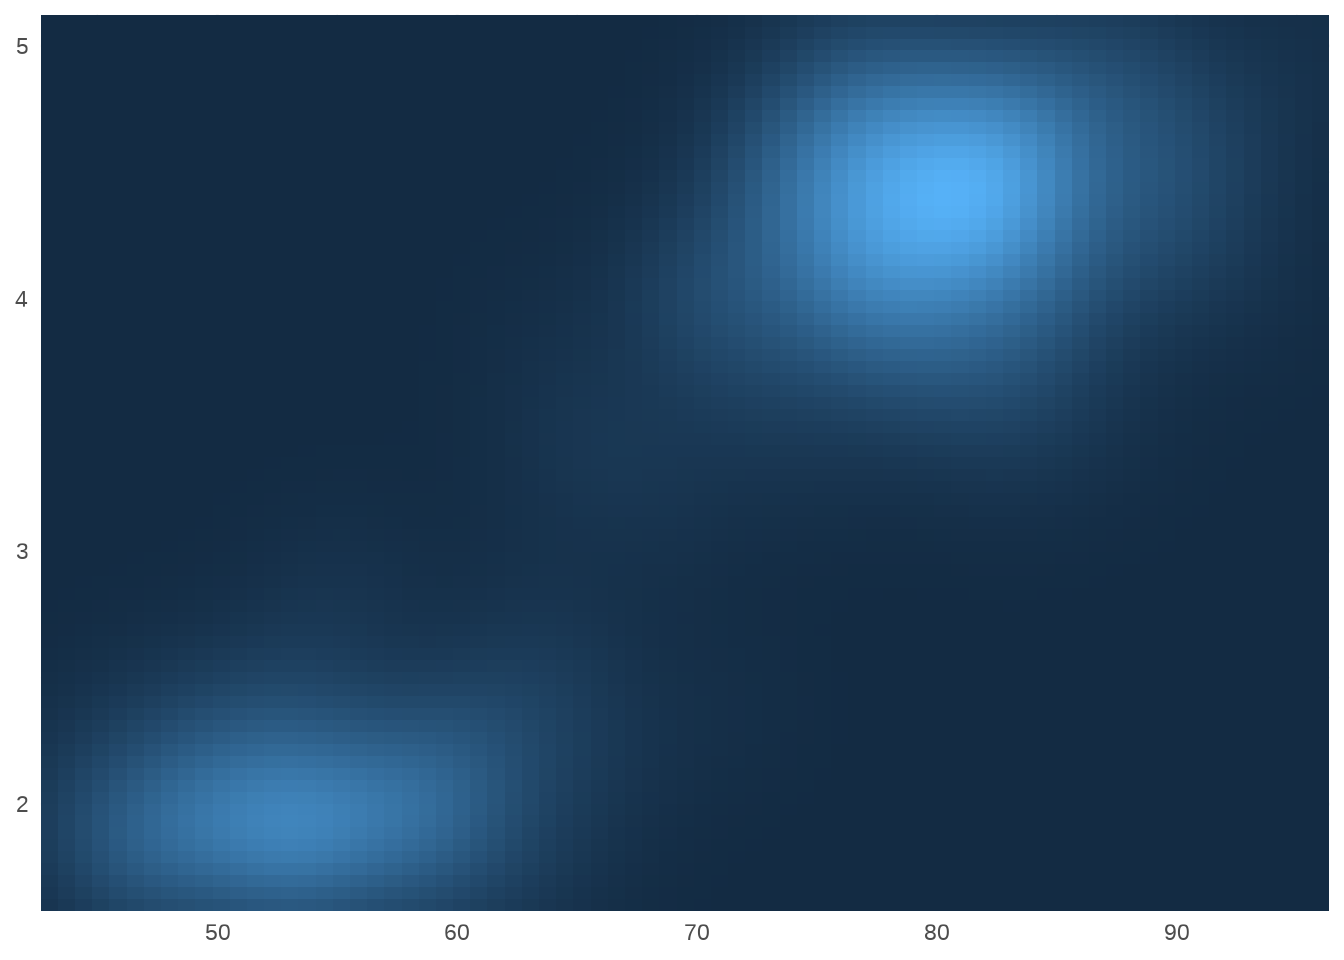
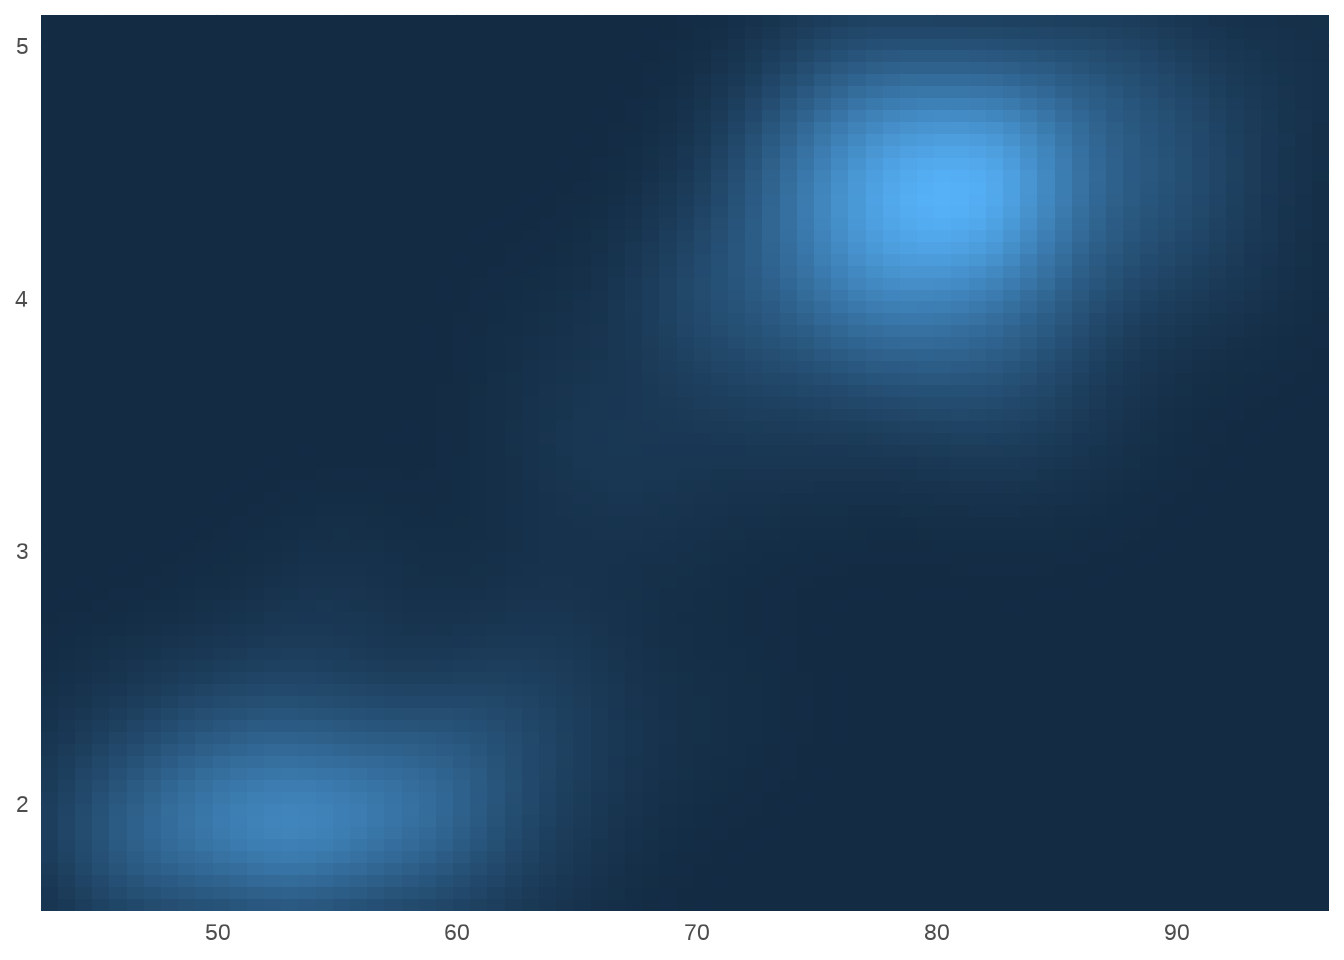
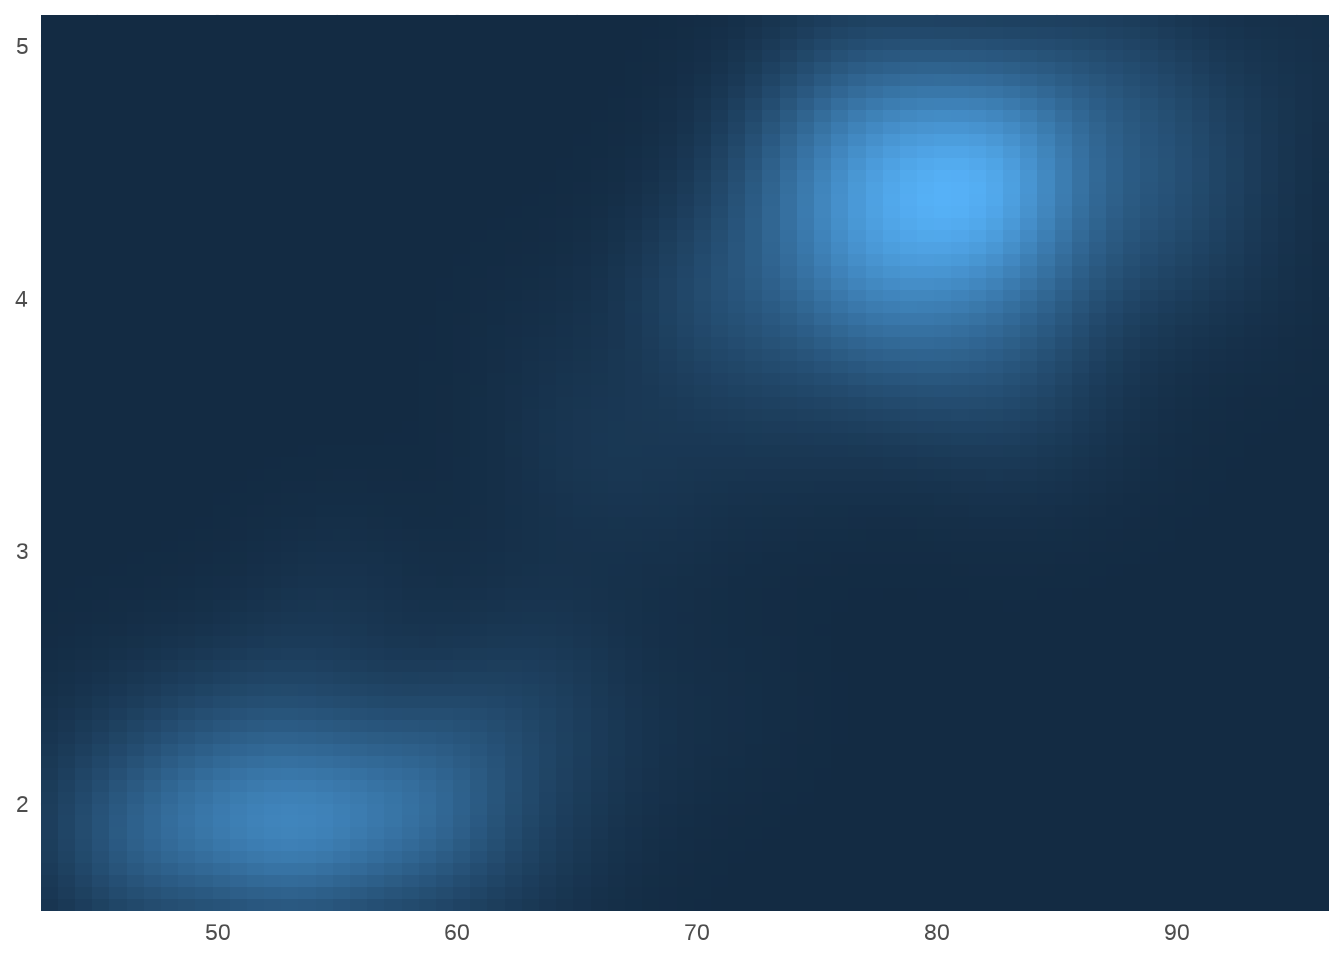
Gradient scales provide a robust method for creating any colour scheme you like. You just specify two or more reference colours, and ggplot2 will interpolate linearly between them. Three functions that you can use for this purpose are
*scale_fill_gradient() produces a two-colour gradient
*scale_fill_gradient2() produces a three-colour gradient with specified midpoint
*scale_fill_gradientn() produces an n-colour gradient
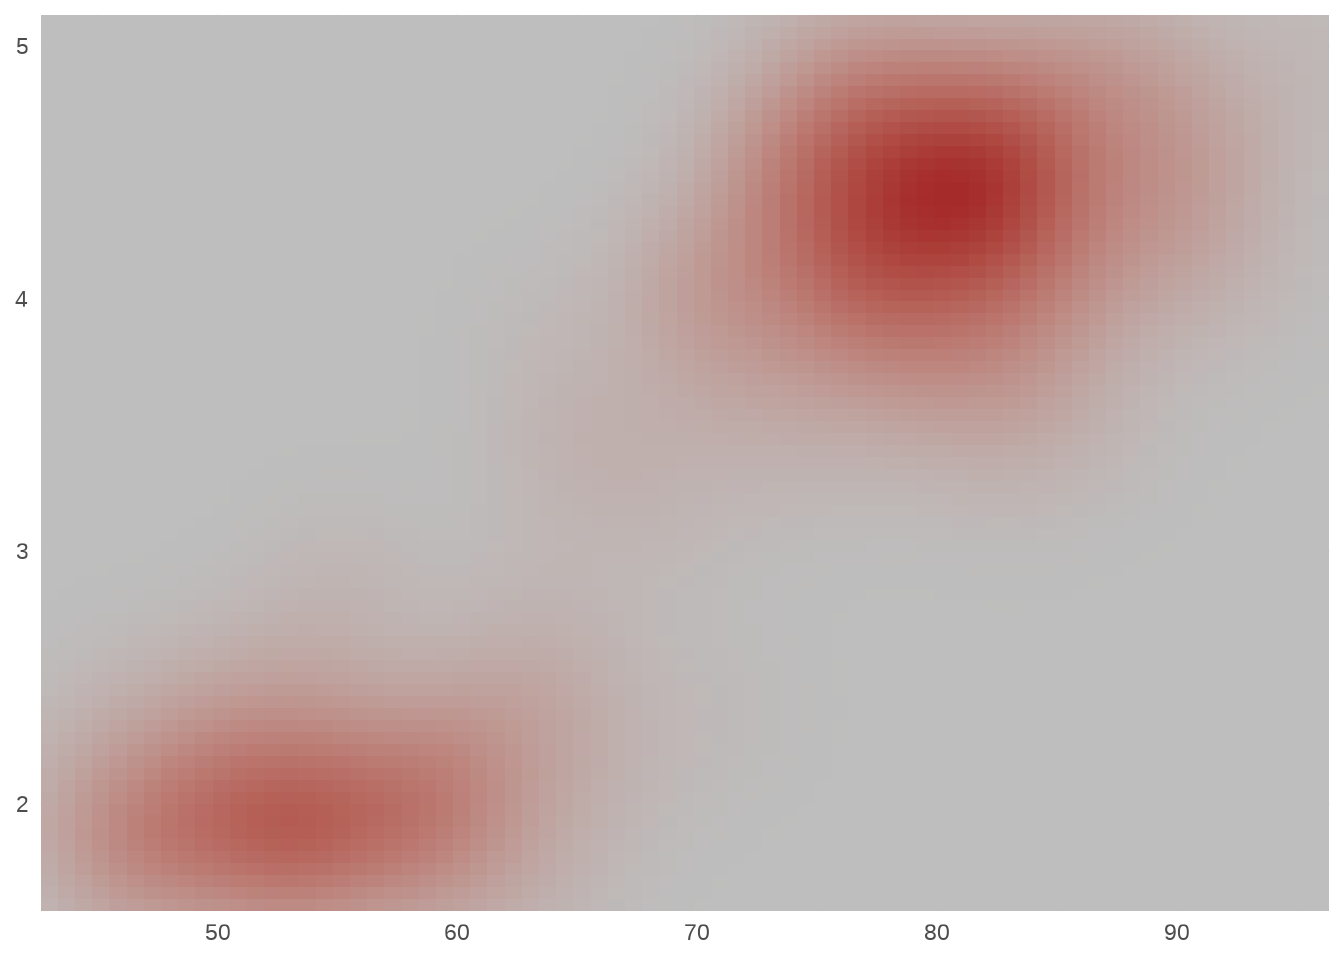
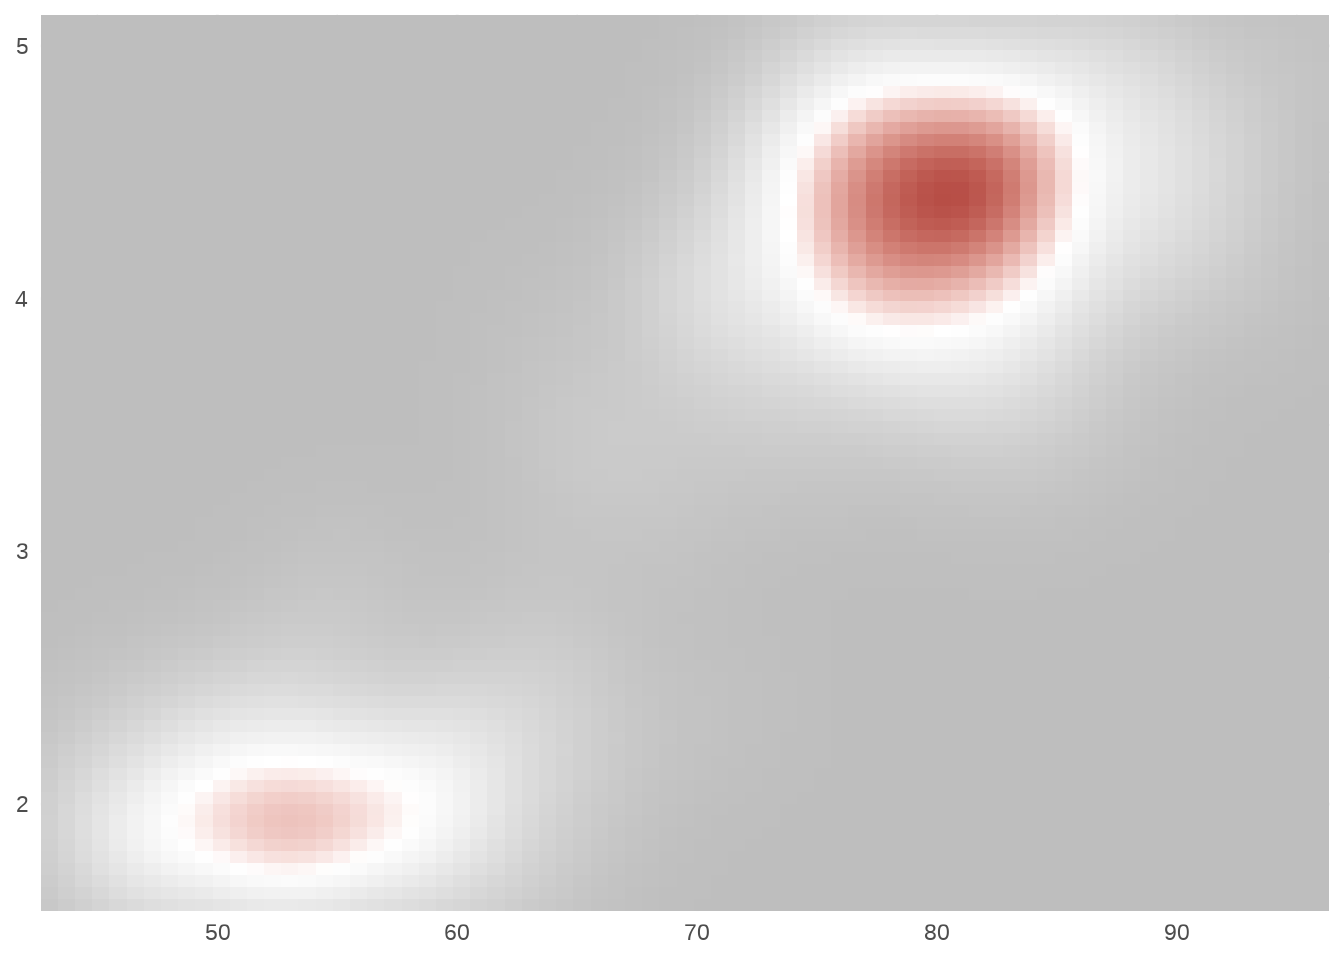
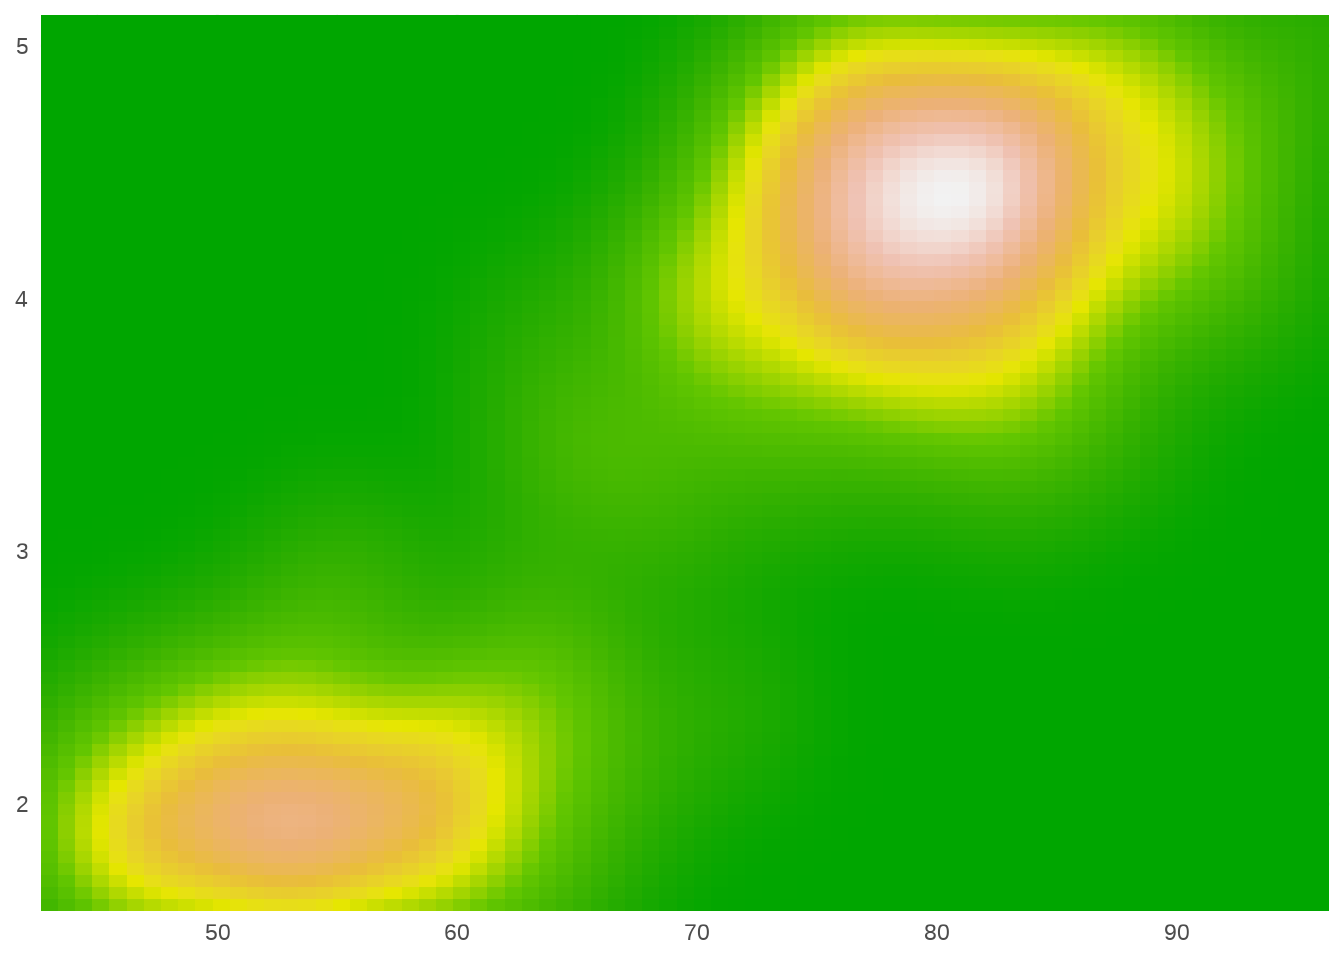
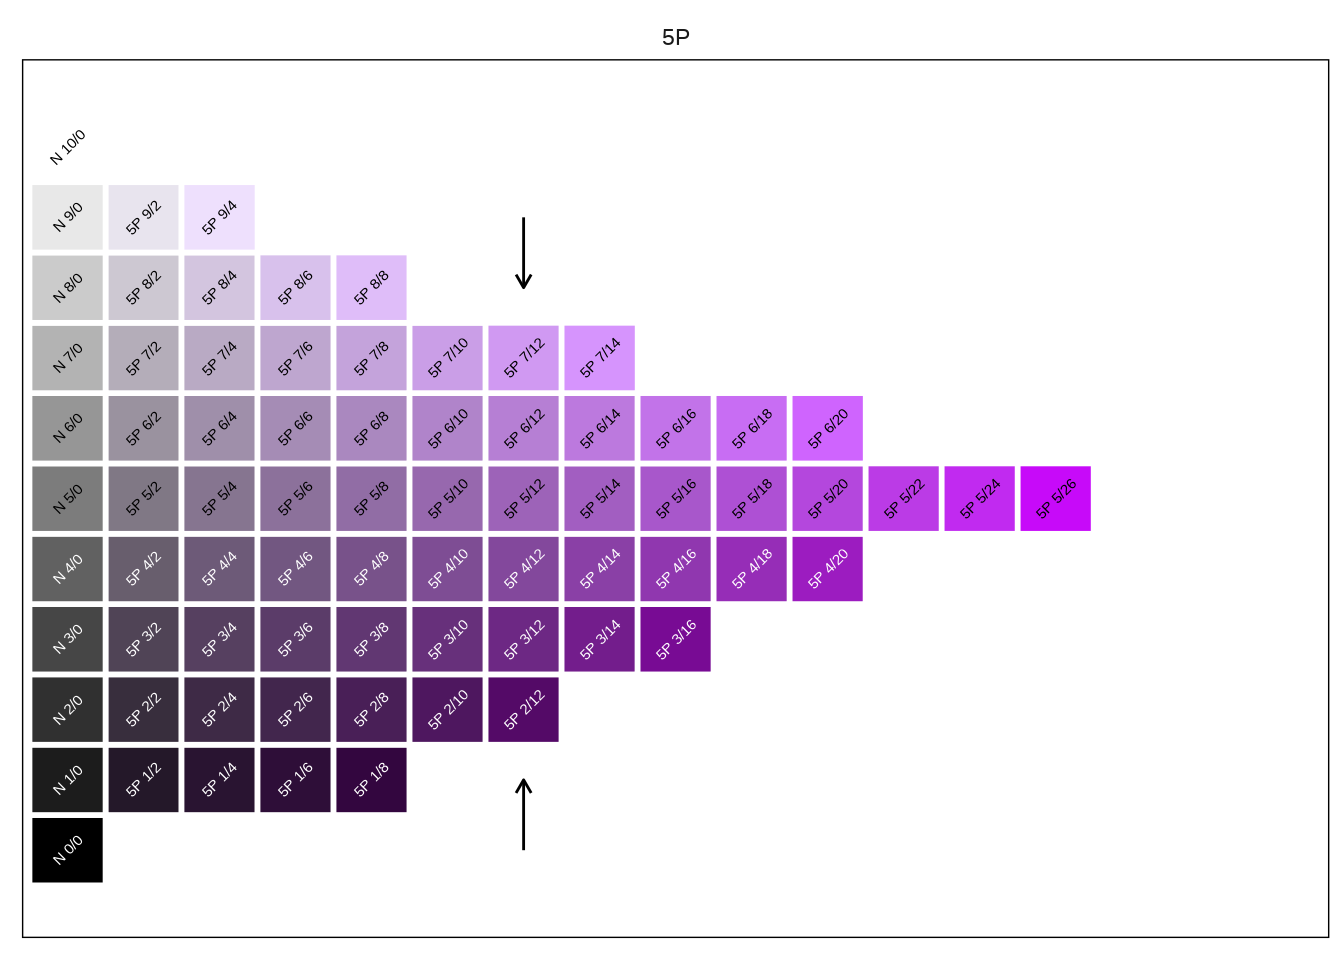
The Munsell colour system provides an easy way of specifying colours based on their hue, chroma and luminance. The munsell package provides easy access to the Munsell colours, which can then be used to specify a gradient scale. For more information on the munsell package see https://github.com/cwickham/munsell/.
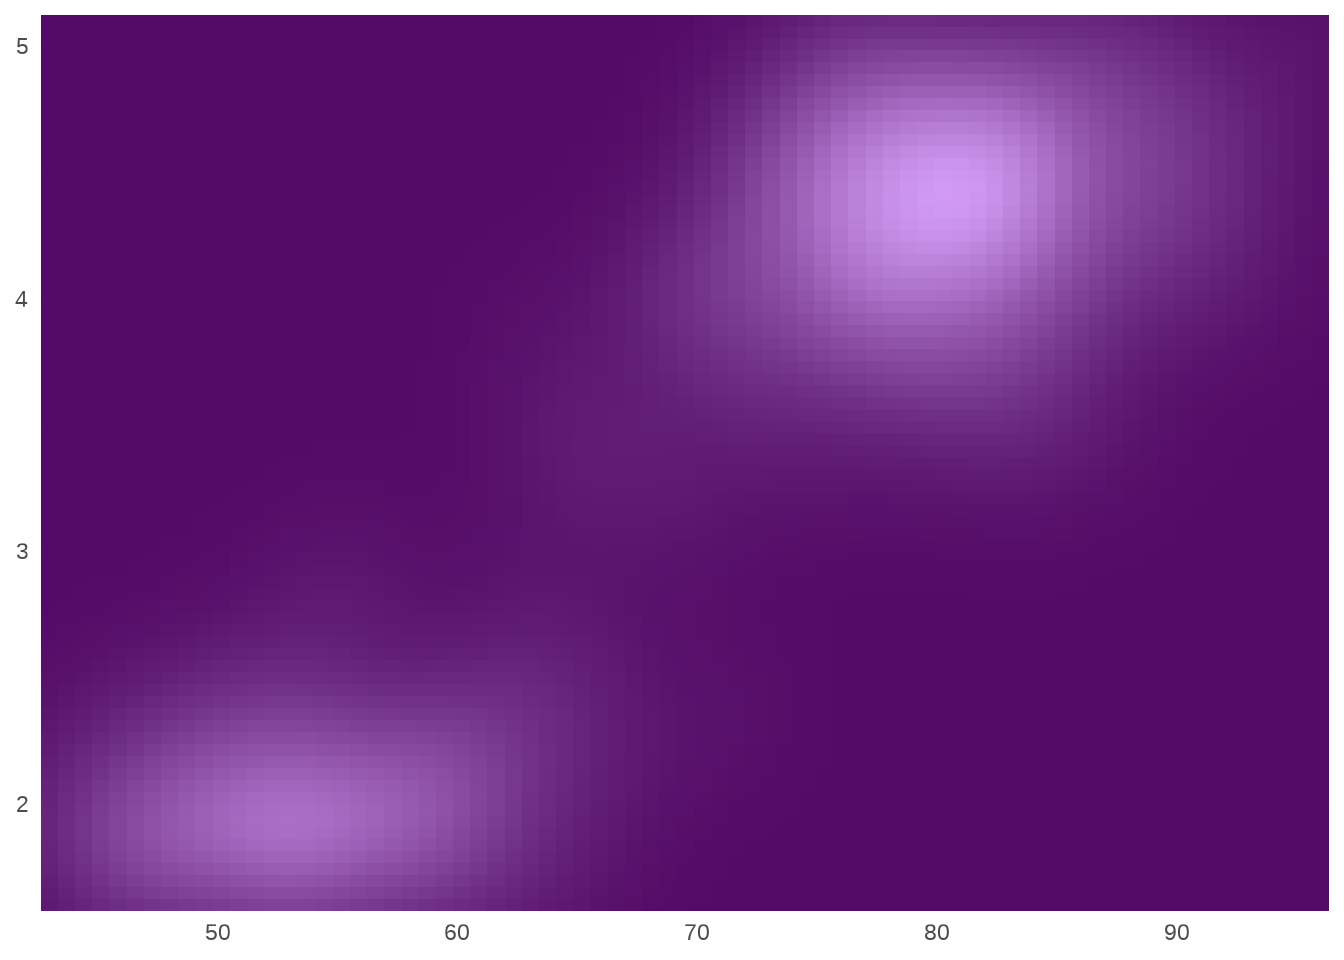
Three-point gradient scales typically convey the perceptual impression that there is a natural midpoint (often a zero value) from which the other values diverge. The left plot below shows how to create a divergent “yellow/blue” scale.
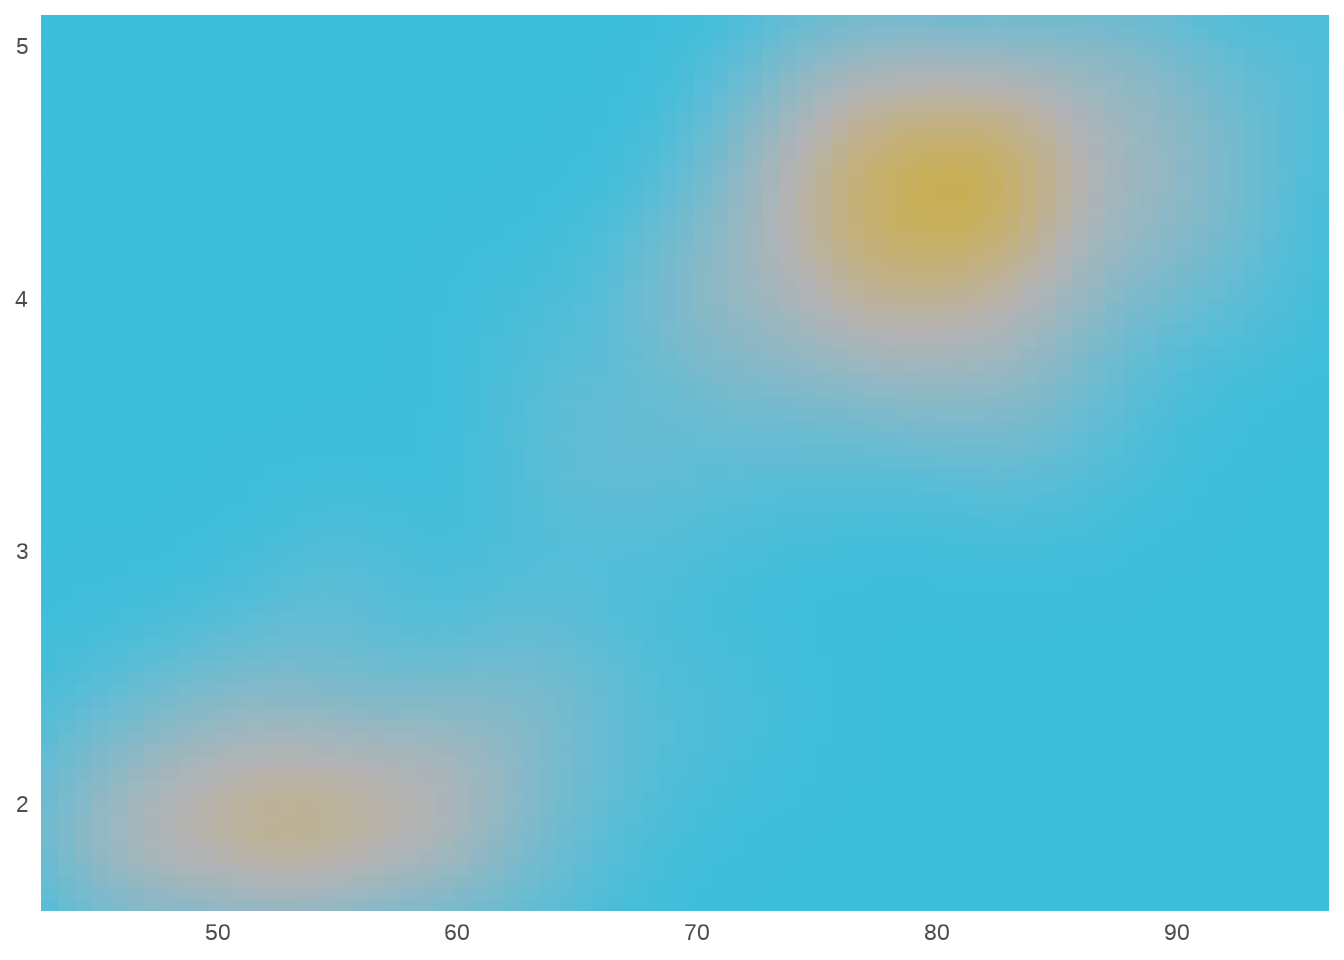
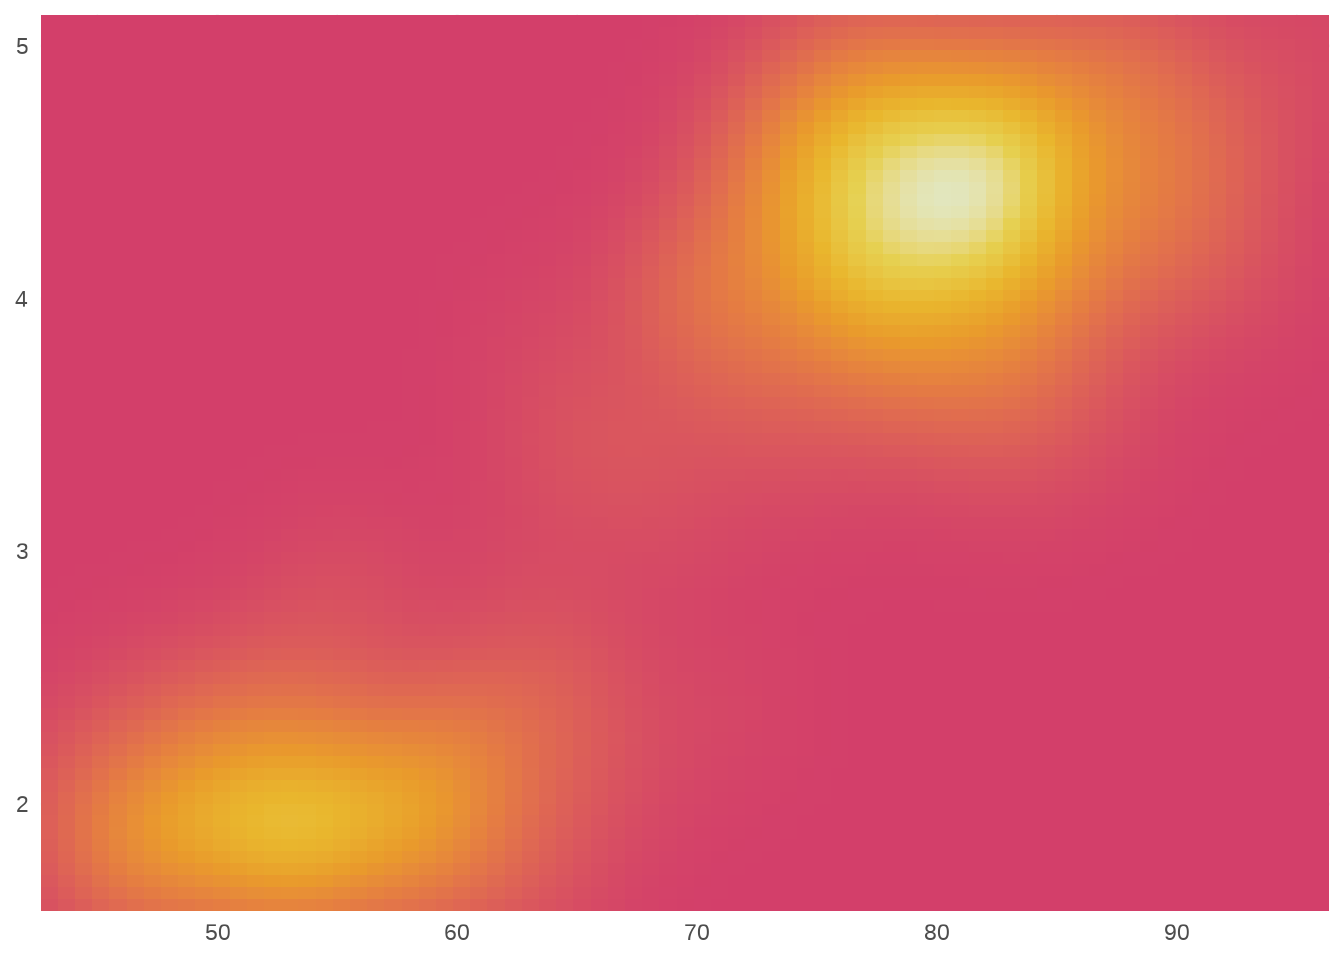
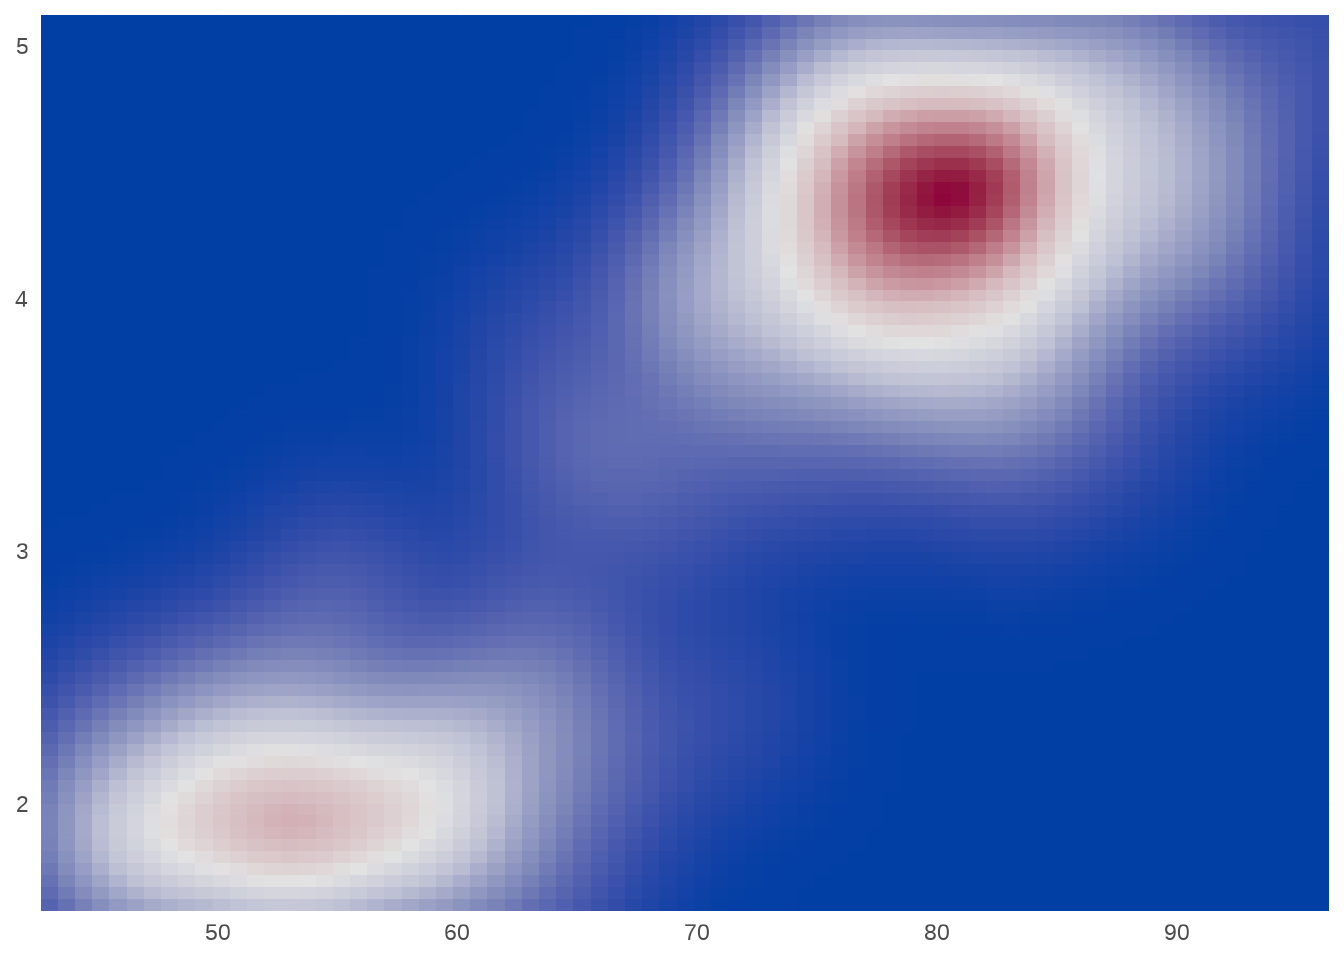
If you have colours that are meaningful for your data (e.g., black body colours or standard terrain colours), or you’d like to use a palette produced by another package, you may wish to use an n-point gradient. The middle and right plots below use the colorspace package. For more information on the colorspace package see https://colorspace.r-forge.r-project.org/.
11.2.3 Missing values
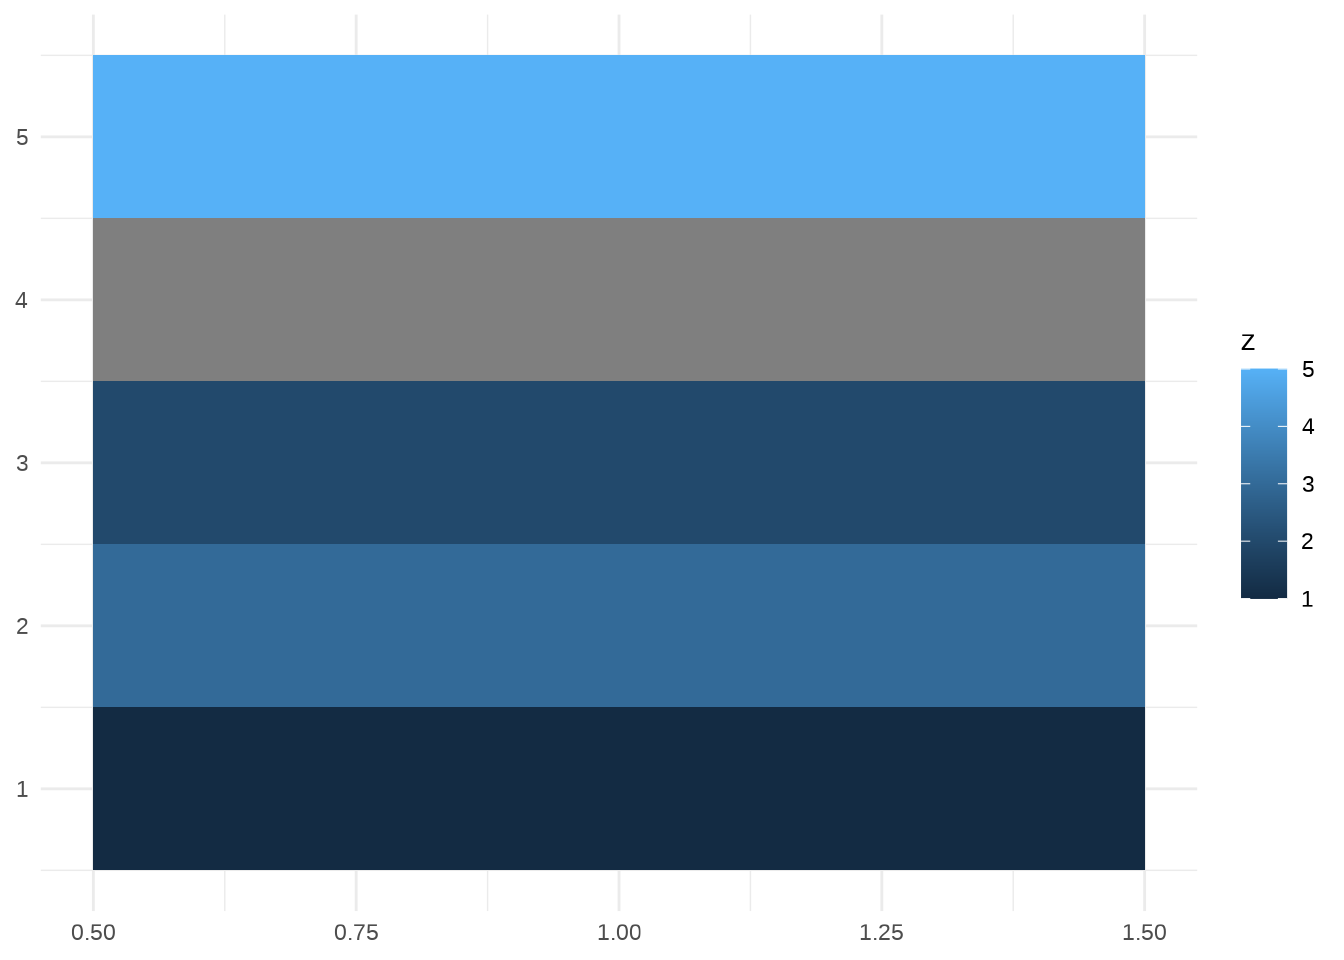
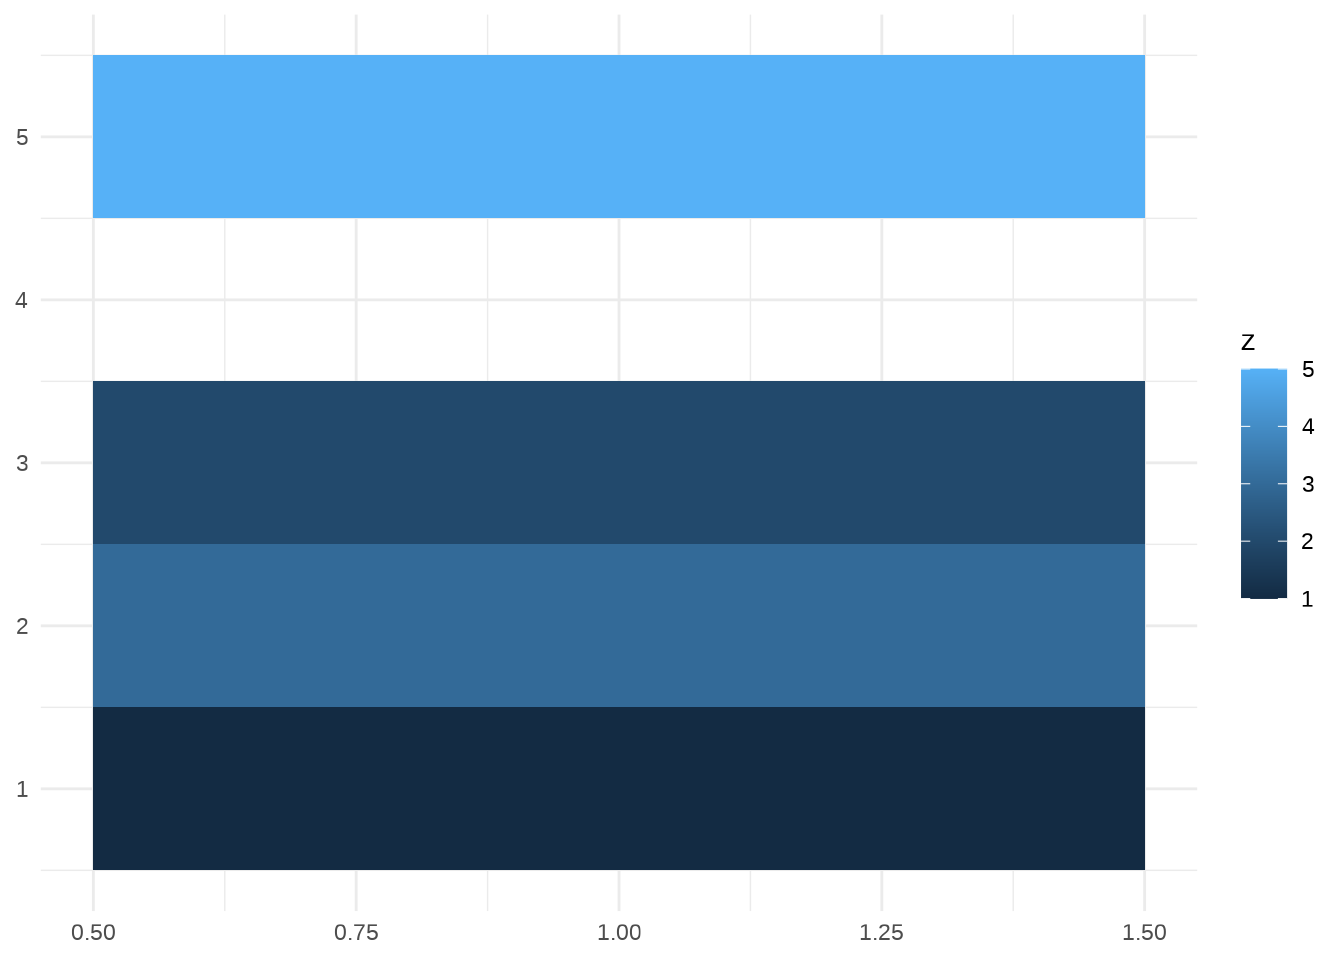
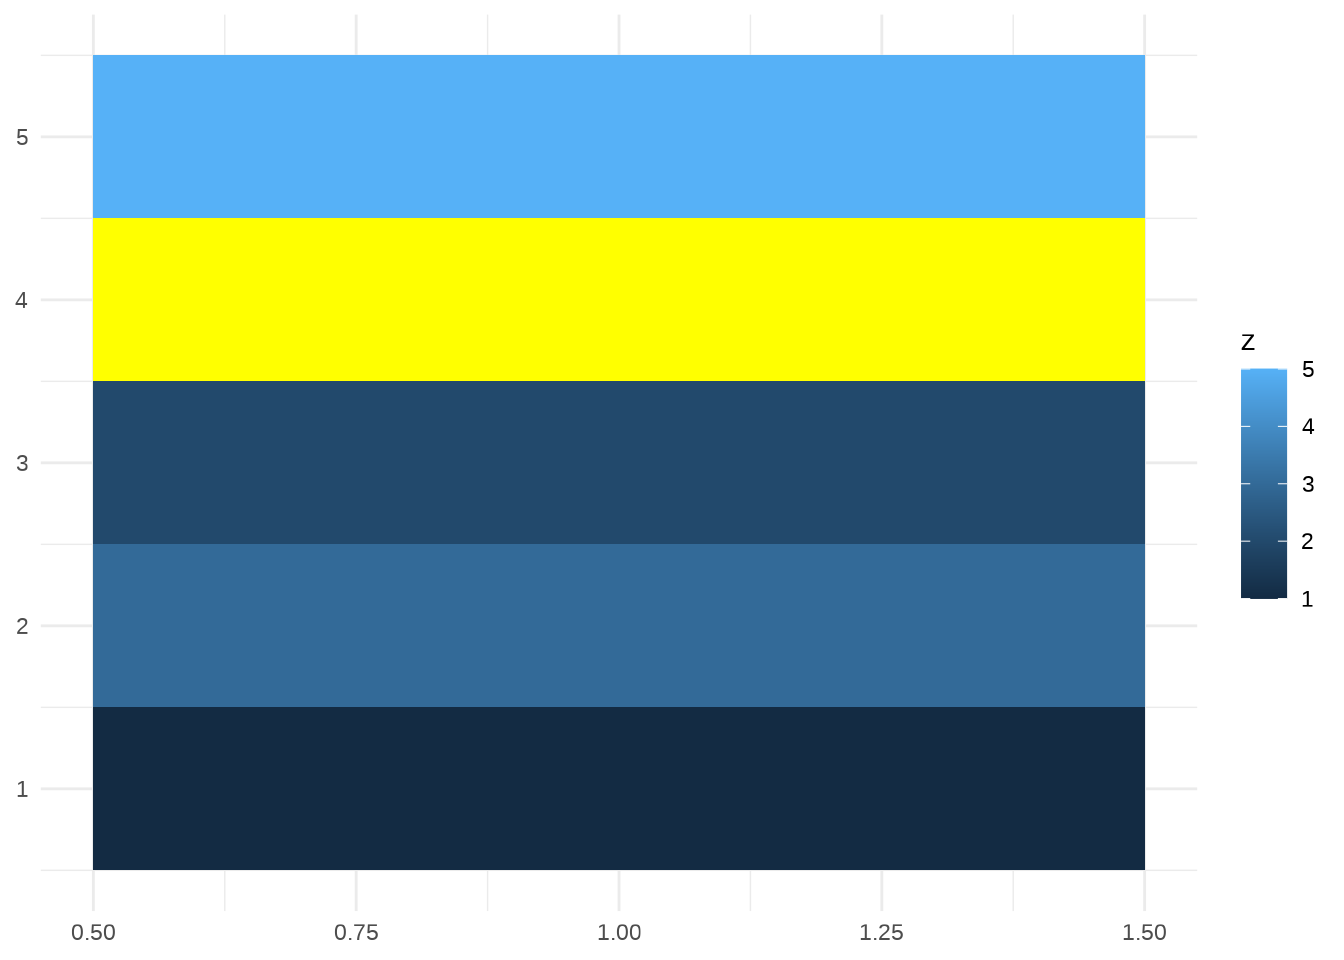
All continuous colour scales have an na.value parameter that controls what colour is used for missing values (including values outside the range of the scale limits). By default it is set to grey, which will stand out when you use a colourful scale. If you use a black and white scale, you might want to set it to something else to make it more obvious. You can set na.value = NA to make missing values invisible, or choose a specific colour if you prefer:
