15.3 Non-linear coordinate systems
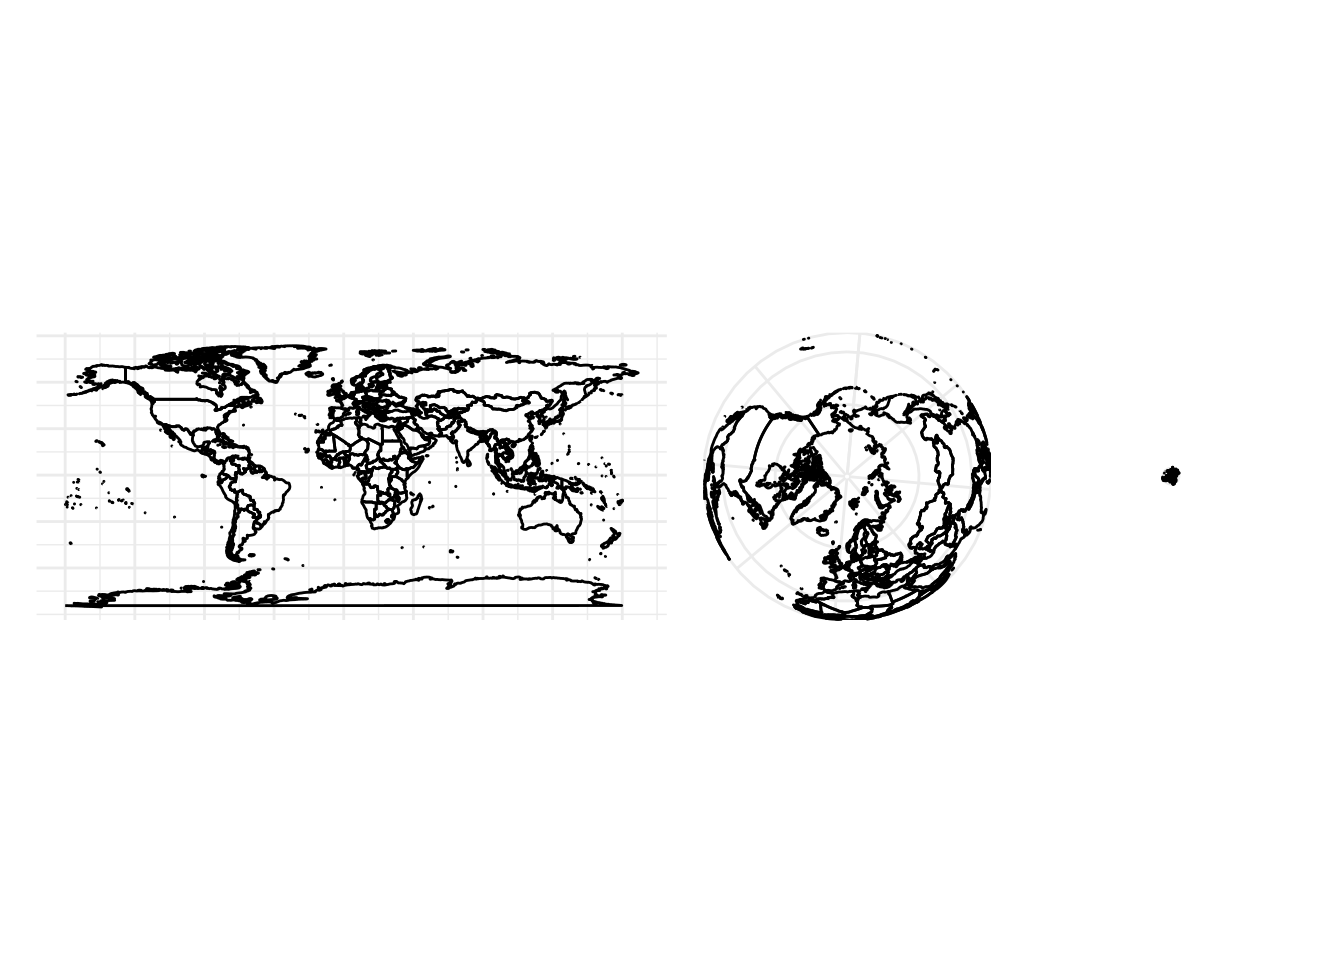
coord_polar(): Polar coordinates.coord_map()/coord_quickmap()/coord_sf(): Map projections.coord_trans(): Apply arbitrary transformations to x and y positions, after the data has been processed by the stat.
coord_polar()
p4 <- iris %>%
  ggplot(aes(x = Species, y = Petal.Width)) +
  geom_col(aes(color=Species,fill=Species),show.legend = F)+
  theme_light()


p4 + coord_polar(theta = "x") | p4 + coord_polar(theta = "y")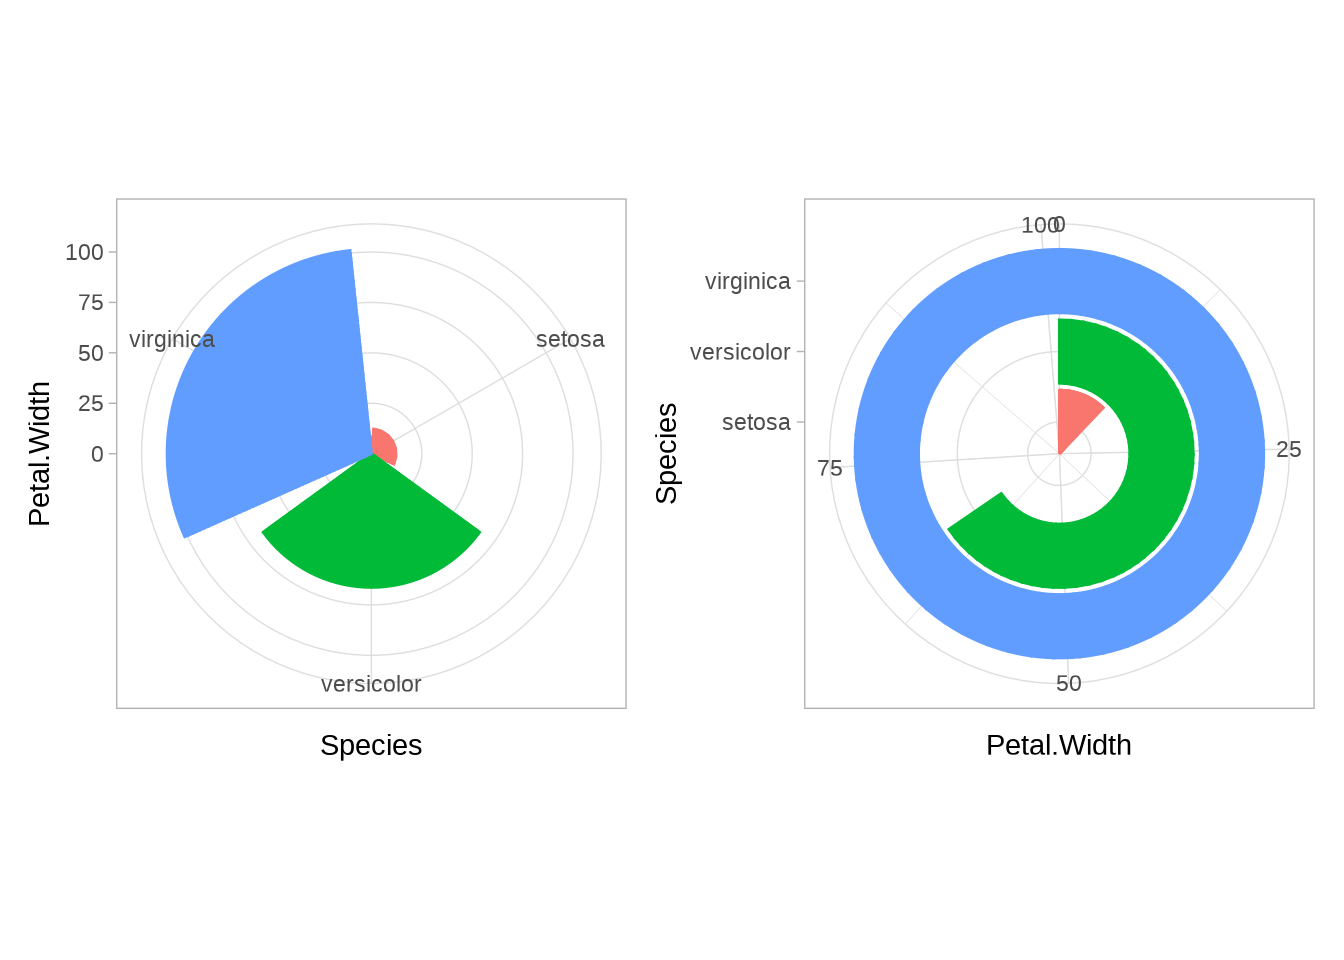
15.3.1 Example: Coord_polar() with DuBoisChallenge N°8 data
source: DuBois data portraits
df <- read_csv("https://raw.githubusercontent.com/ajstarks/dubois-data-portraits/master/challenge/2022/challenge08/data.csv")

df2 <- df %>%
  arrange(-Year)

df2[7,1]  <- 1875
df2[7,2]  <- 0
df2[7,3]  <- 0
df2 %>%
ggplot() +
geom_line(data= subset(df2, Year %in% c(1875,1875)),
mapping = aes(x=Year, y= `Houshold Value (Dollars)`),
color="#FFCDCB",size=6) +
geom_line(data= subset(df2, Year%in%c(1875,1875,1880)),
mapping= aes(x=Year +2, y= `Houshold Value (Dollars)`),
color="#989EB4",size=6) +
geom_line(data= subset(df2, Year%in%c(1875,1875,1880,1885)),
mapping= aes(x=Year +4, y= `Houshold Value (Dollars)`),
color="#b08c71",size=6) +
geom_line(data= subset(df2, Year%in%c(1875,1875,1880,1885,1890)),
mapping= aes(x=Year +6, y= `Houshold Value (Dollars)`),
color="#FFC942",size=6) +
geom_line(data= subset(df2, Year%in%c(1875,1875,1880,1885,1890,1895)),
mapping= aes(x=Year +8, y= `Houshold Value (Dollars)`),
color="#EFDECC", size=6) +
geom_line(mapping= aes(x=Year +10, y= `Houshold Value (Dollars)`),
color="#F02C49",size=6) +
coord_polar(theta = "y",
start = 0,
direction = 1,
clip = "off") +
# other scales that can be used:
#scale_x_reverse(expand=expansion(mult=c(-0.9,-0.1),add=c(29,-0.1))) +
#scale_y_continuous(expand=expansion(mult=c(0.09,0.01),add=c(0,-790000))) +
scale_x_reverse(expand=expansion(add=c(11,-5))) +
scale_y_continuous(expand=expansion(add=c(0,-600000))) +
labs(title="ASSESSED VALUE OF HOUSEHOLD AND KITCHEN FURNITURE
OWNED BY GEORGIA NEGROES.")+
theme_void() +
theme(text = element_text(face="bold",
color="grey27"),
aspect.ratio =2/1.9, #y/x
plot.background = element_rect(color= "#d9ccbf", fill= "#d9ccbf"),
plot.title = element_text(hjust=0.5,size=9))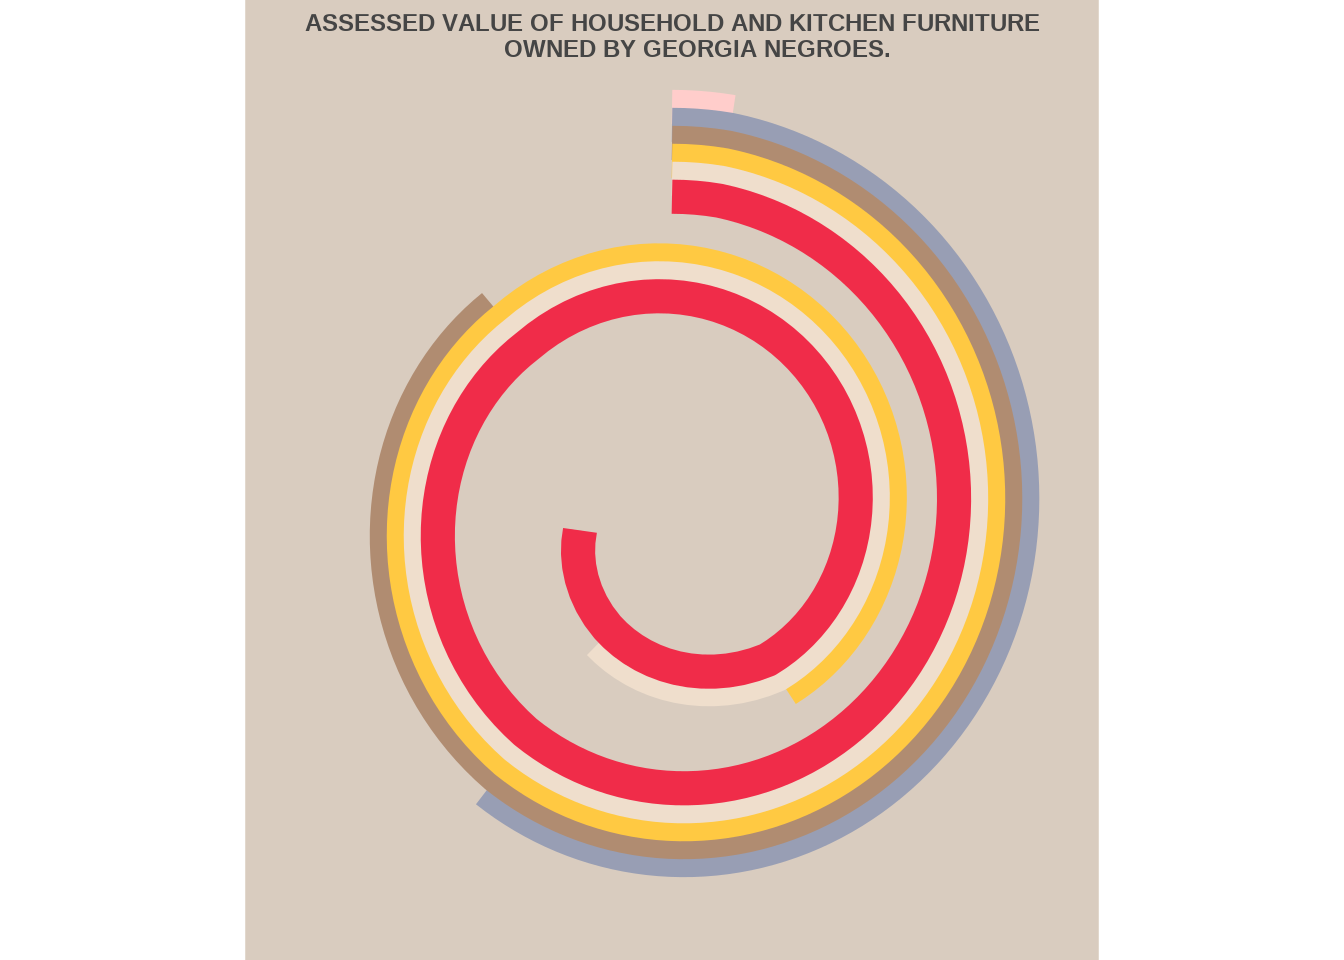
coord_trans()
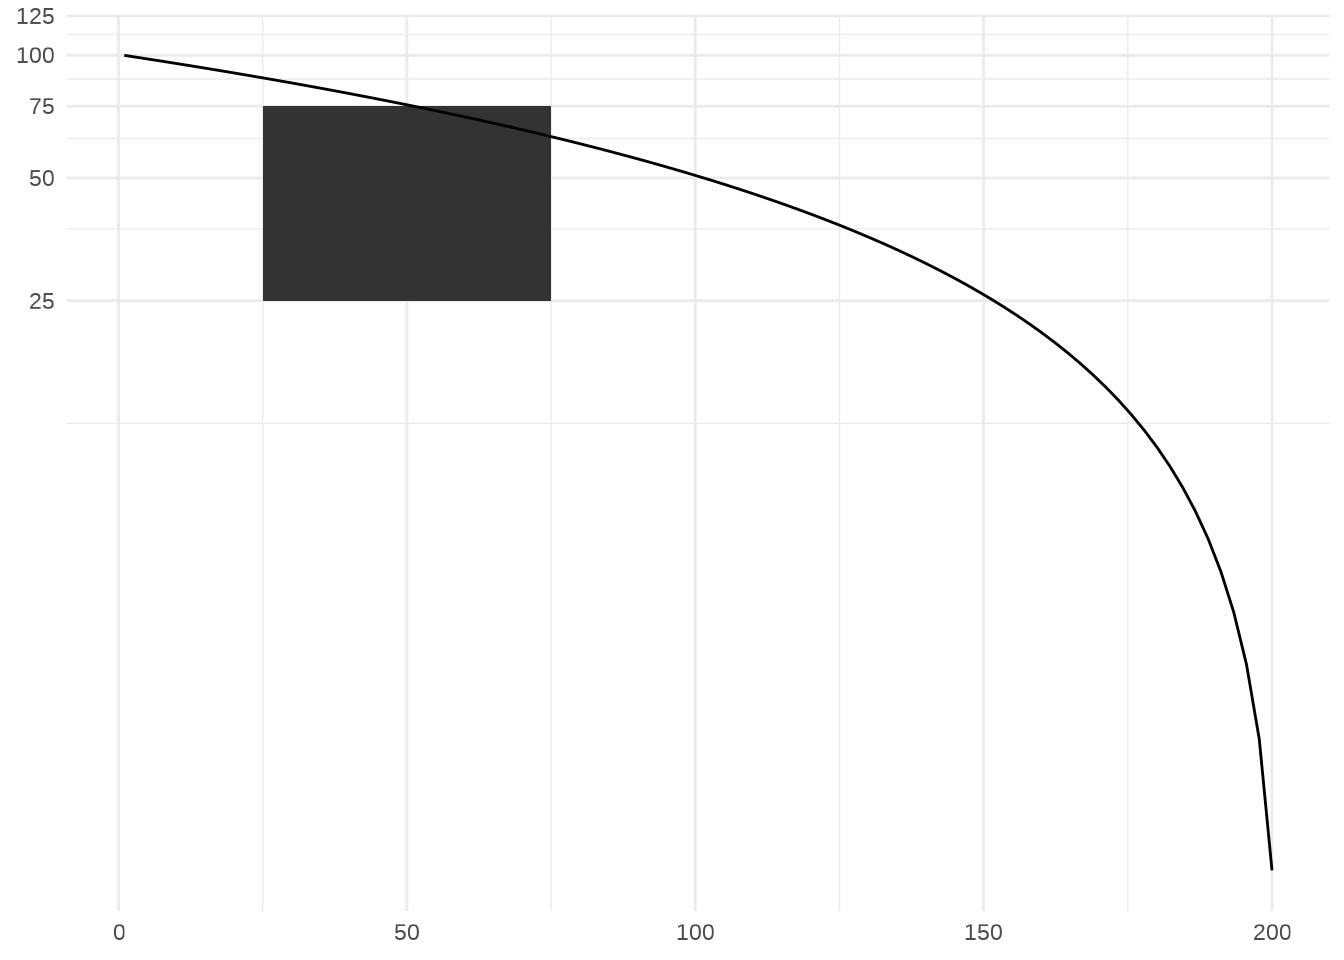
rect <- data.frame(x = 50, y = 50)
line <- data.frame(x = c(1, 200), y = c(100, 1))
p6 <- ggplot(mapping = aes(x, y)) +
  geom_tile(data = rect, aes(width = 50, height = 50)) +
  geom_line(data = line) +
  xlab(NULL) + ylab(NULL)

p6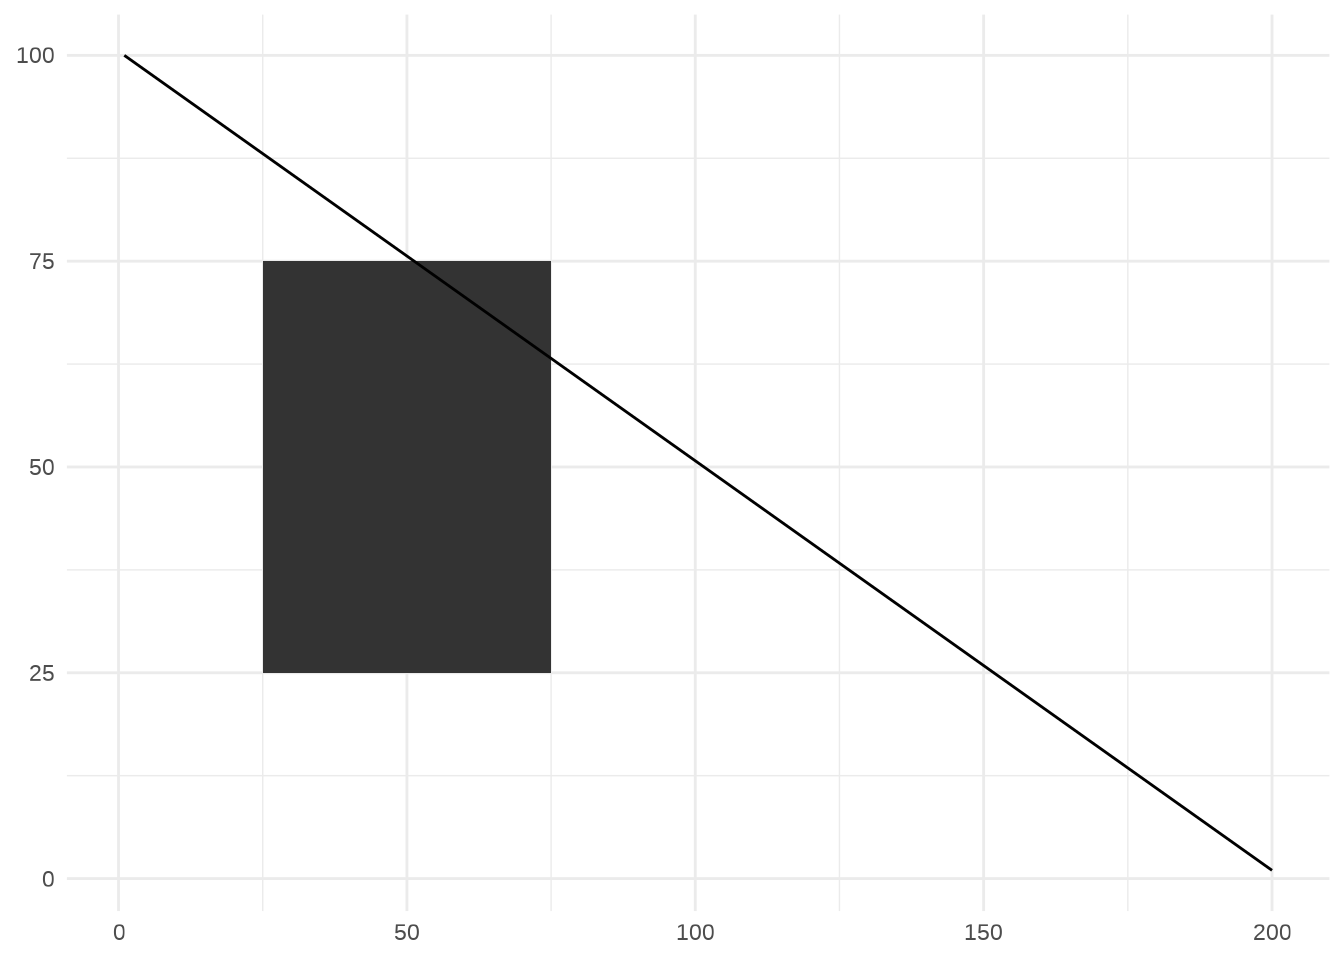
p7 <- ggplot(iris, aes(Sepal.Length, Petal.Length)) +
  stat_bin2d() +
  geom_smooth(method = "lm") +
  xlab(NULL) +
  ylab(NULL) +
  theme(legend.position = "none")
p7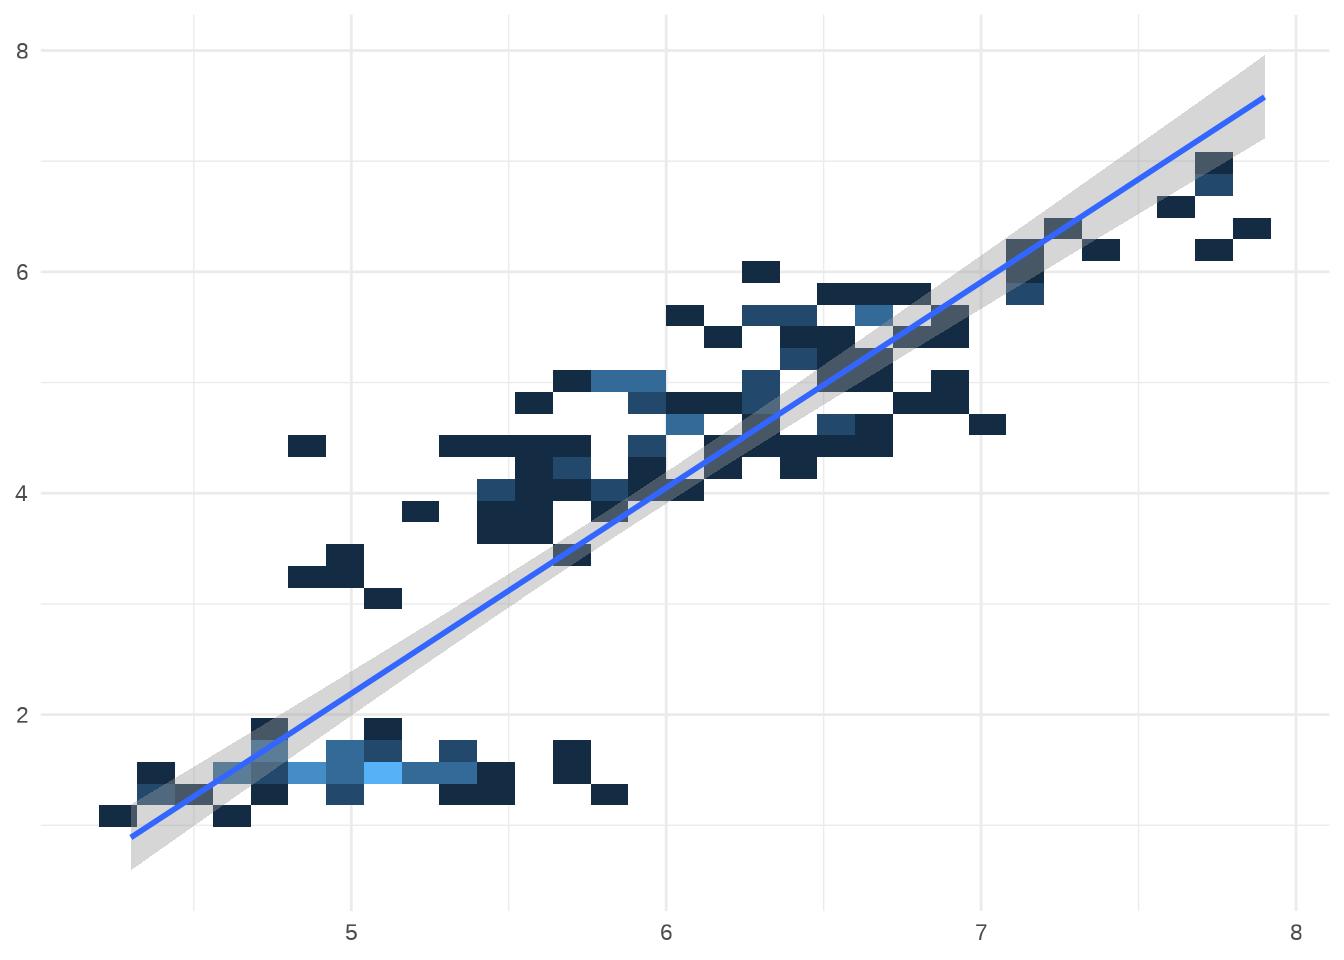
#> `geom_smooth()` using formula 'y ~ x'

# Better fit on log scale, but harder to interpret
p7 +
  scale_x_log10() +
  scale_y_log10()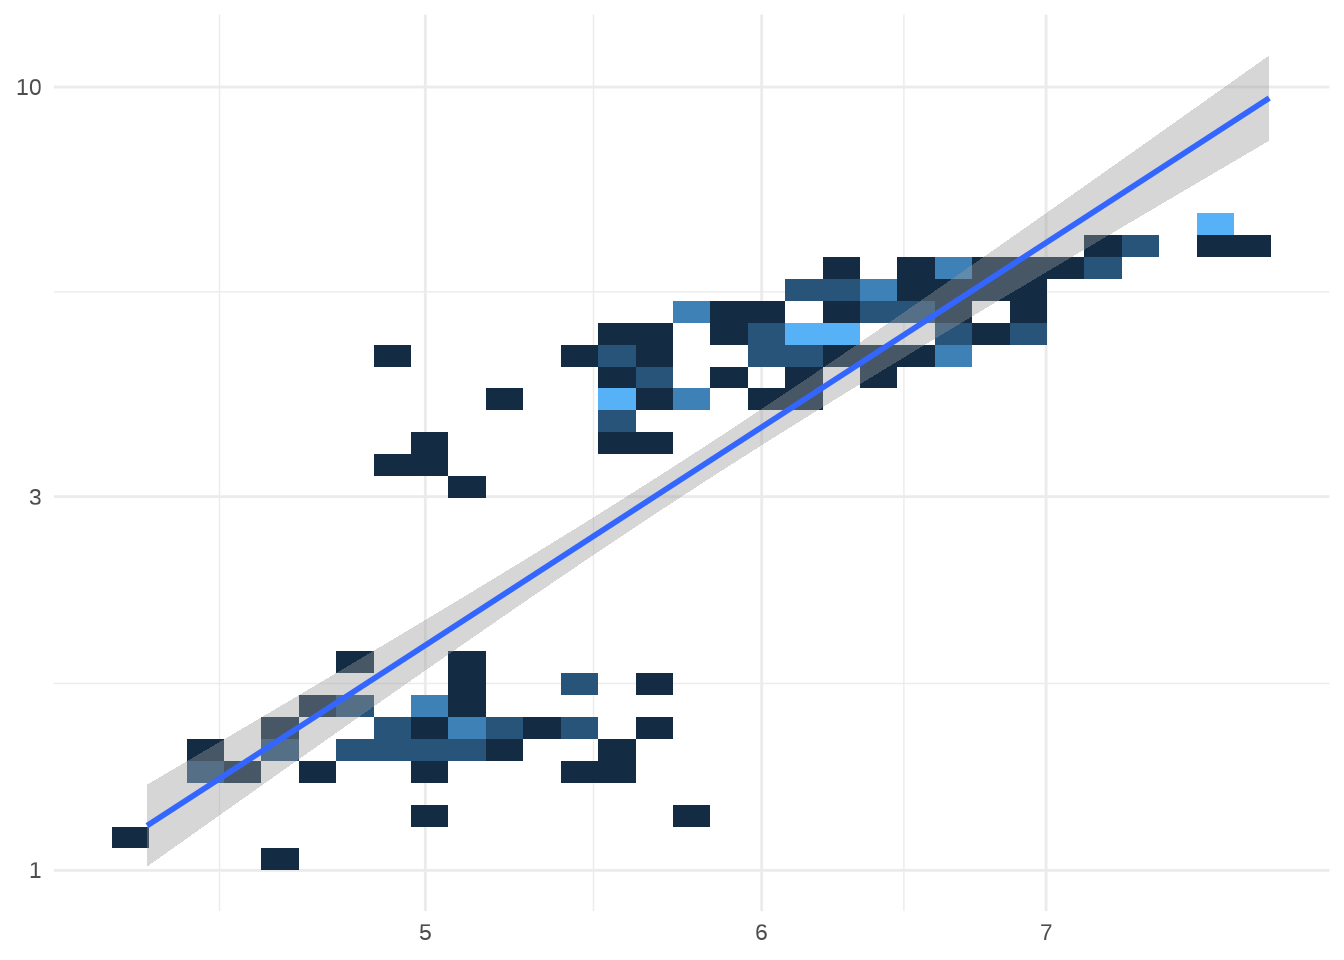
#> `geom_smooth()` using formula 'y ~ x'

# Fit on log scale, then backtransform to original.
# Highlights lack of expensive diamonds with large carats
pow10 <- scales::exp_trans(10)
p7 +
  scale_x_log10() +
  scale_y_log10() +
  coord_trans(x = pow10, y = pow10)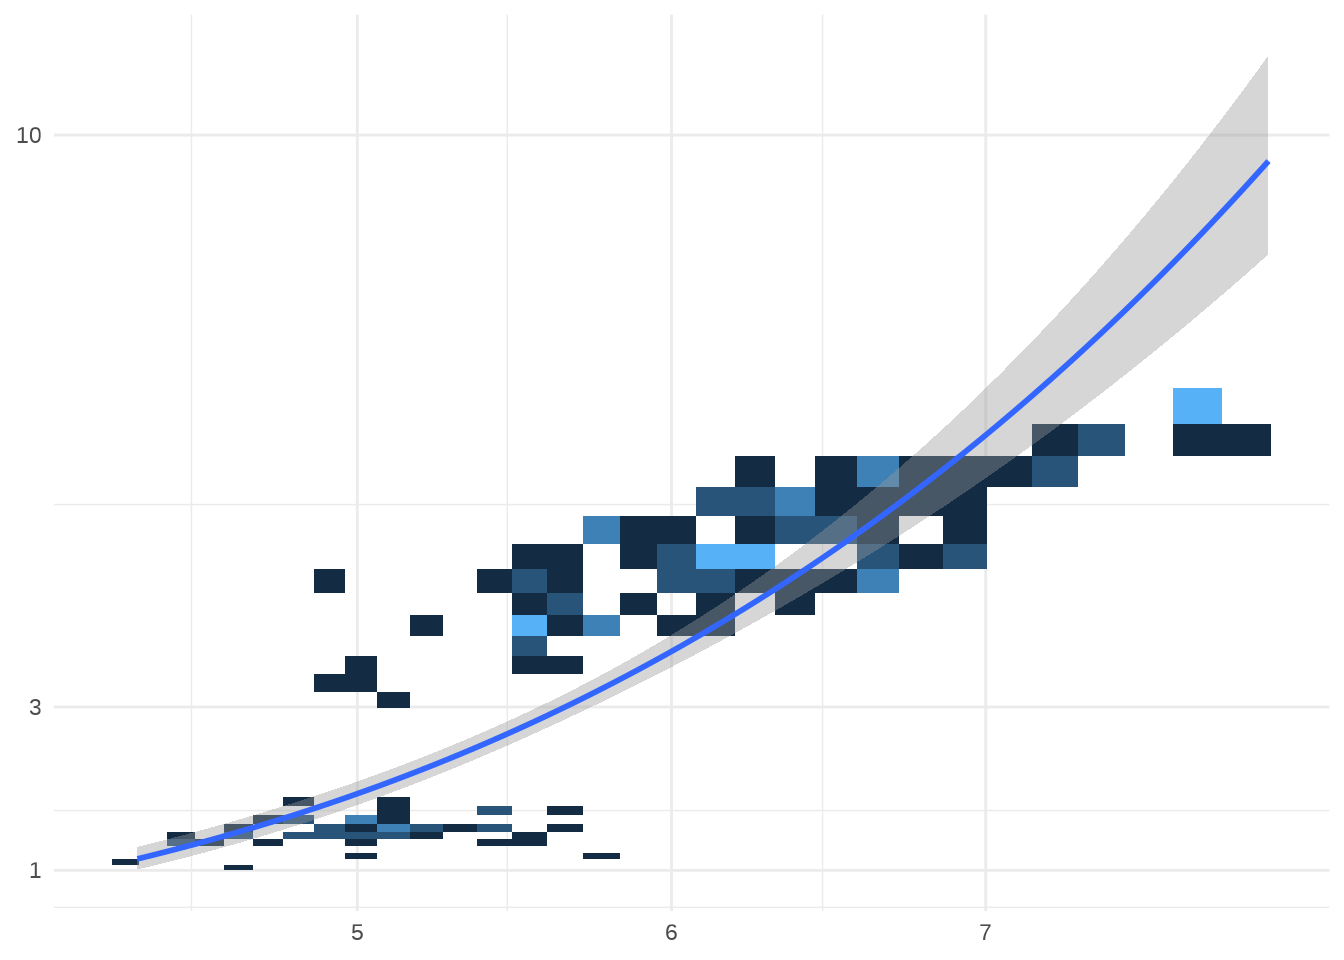
coord_map()/coord_quickmap()/coord_sf()
world <- map_data("world")
worldmap <- ggplot(world, aes(long, lat, group = group)) +
  geom_path() +
  scale_y_continuous(NULL, breaks = (-2:3) * 30, labels = NULL) +
  scale_x_continuous(NULL, breaks = (-4:4) * 45, labels = NULL)


worldmap + coord_quickmap() |
worldmap + coord_map("ortho") |
worldmap + coord_map("stereographic")