19.3 The gtable step
Again, still working with our plot p
p <- ggplot(mpg, aes(displ, hwy, color = drv)) +
geom_point(position = position_jitter(seed = 2022)) +
geom_smooth(method = "lm", formula = y ~ x) +
facet_wrap(vars(year)) +
ggtitle("A plot for expository purposes")
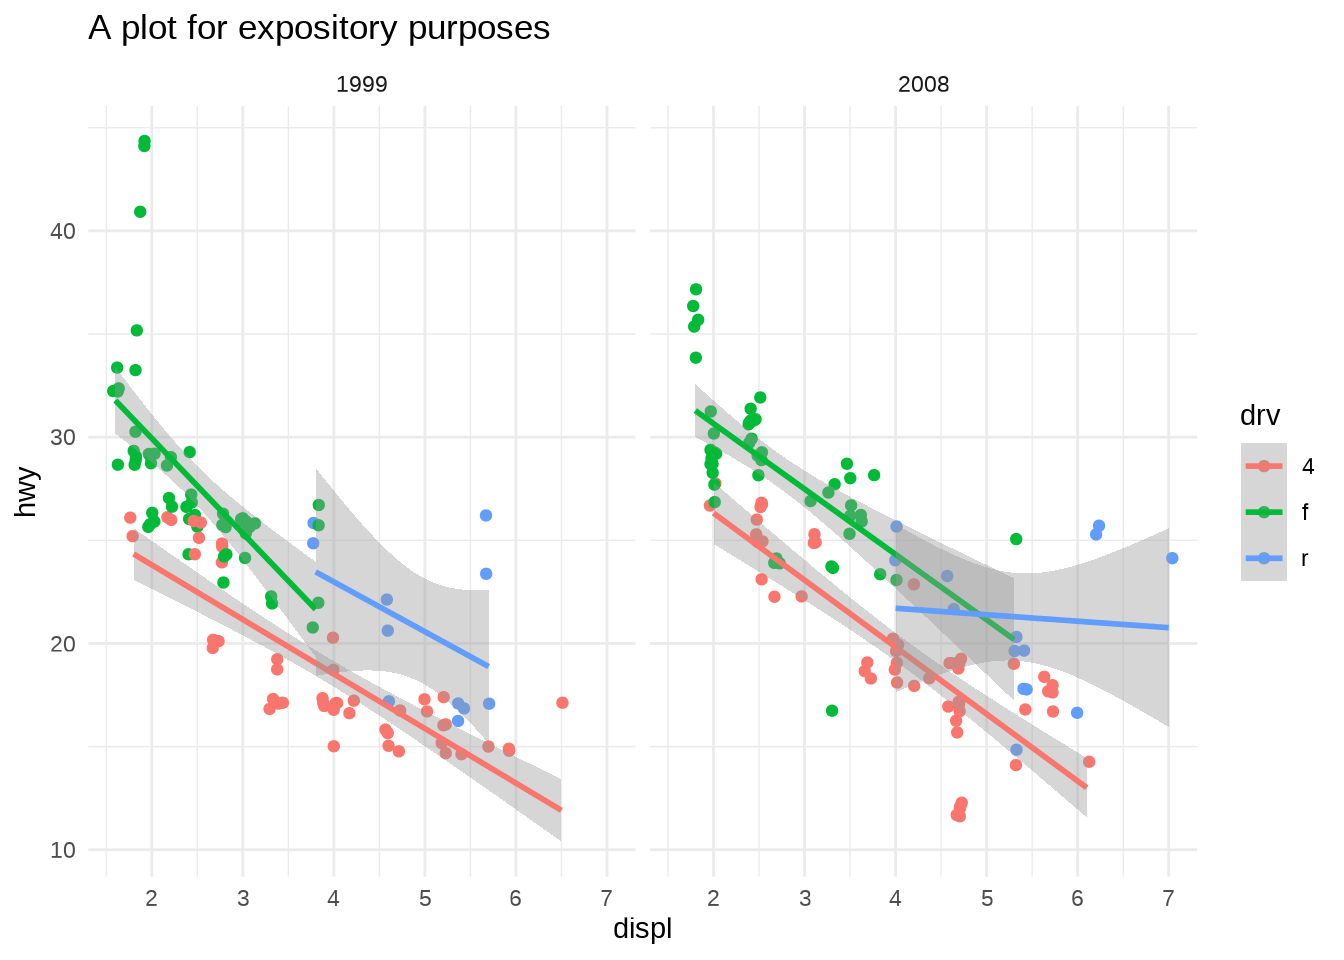
The return value of ggplot_build()
contains the computed data associated with each layer and a Layout
ggproto object which holds information about data other than the layers, including the scales, coordinate system, facets, etc.
[1] "data" "layout" "plot"
[1] "Layout" "ggproto" "gg"
The output of ggplot_build()
is then passed to ggplot_gtable()
to be converted into graphical elements before being drawn:
function (x, newpage = is.null(vp), vp = NULL, ...)
{
set_last_plot(x)
if (newpage)
grid.newpage()
grDevices::recordGraphics(requireNamespace("ggplot2", quietly = TRUE),
list(), getNamespace("ggplot2"))
data <- ggplot_build(x)
gtable <- ggplot_gtable(data)
if (is.null(vp)) {
grid.draw(gtable)
}
else {
if (is.character(vp))
seekViewport(vp)
else pushViewport(vp)
grid.draw(gtable)
upViewport()
}
if (isTRUE(getOption("BrailleR.VI")) && rlang::is_installed("BrailleR")) {
print(asNamespace("BrailleR")$VI(x))
}
invisible(x)
}
<bytecode: 0x5626733081f8>
<environment: namespace:ggplot2>
19.3.1 Rendering the panels
First, each layer is converted into a list of graphical objects (
grobs
) …
geom_grobs <- by_layer(function(l, d) l$draw_geom(d, layout),
plot$layers, data, "converting geom to grob")
This step draws loops through each layer, taking the layer object l
and the data associated with that layer d
and using the Geom from the layer to draw the data.
geom_grobs <- ggtrace_inspect_vars(
x = p, method = ggplot2:::ggplot_gtable.ggplot_built,
at = 7, vars = "geom_grobs"
)
geom_grobs
[[1]]
[[1]]$`1`
points[geom_point.points.31105]
[[1]]$`2`
points[geom_point.points.31107]
[[2]]
[[2]]$`1`
gTree[geom_smooth.gTree.31124]
[[2]]$`2`
gTree[geom_smooth.gTree.31141]
The geom_grobs
calculated at this step can also be accessed using the layer_grob()
function on the ggplot object, which is similar to the layer_data()
function:
[[1]]
[[1]]$`1`
points[geom_point.points.31265]
[[1]]$`2`
points[geom_point.points.31267]
[[2]]
[[2]]$`1`
gTree[geom_smooth.gTree.31284]
[[2]]$`2`
gTree[geom_smooth.gTree.31301]
Each element of geom_grobs
is a list of graphical objects representing a layer’s data in a facet. For example, this draws the data plotted by the first layer in the first facet
After this, the facet takes over and assembles the panels…
The graphical representation of each layer in each facet are combined with other “non-data” elements of the plot at this step, where the plot_table
variable is defined.
legend_box <- plot$guides$assemble(theme)
plot_table <- ggtrace_inspect_vars(
x = p, method = ggplot2:::ggplot_gtable.ggplot_built,
at = 9, vars = "plot_table"
)
plot_table
is a special grob
called a gtable
, which is the same structure as the final form of the ggplot figure before it’s sent off to the rendering system to get drawn:
TableGrob (6 x 9) "layout": 16 grobs
z cells name grob
1 1 (4-4,3-3) panel-1-1 gTree[panel-1.gTree.31353]
2 1 (4-4,7-7) panel-2-1 gTree[panel-2.gTree.31367]
3 3 (2-2,3-3) axis-t-1-1 zeroGrob[NULL]
4 3 (2-2,7-7) axis-t-2-1 zeroGrob[NULL]
5 3 (5-5,3-3) axis-b-1-1 absoluteGrob[GRID.absoluteGrob.31370]
6 3 (5-5,7-7) axis-b-2-1 absoluteGrob[GRID.absoluteGrob.31370]
7 3 (4-4,6-6) axis-l-1-2 zeroGrob[NULL]
8 3 (4-4,2-2) axis-l-1-1 absoluteGrob[GRID.absoluteGrob.31376]
9 3 (4-4,8-8) axis-r-1-2 zeroGrob[NULL]
10 3 (4-4,4-4) axis-r-1-1 zeroGrob[NULL]
11 2 (3-3,3-3) strip-t-1-1 gtable[strip]
12 2 (3-3,7-7) strip-t-2-1 gtable[strip]
13 4 (1-1,3-7) xlab-t zeroGrob[NULL]
14 5 (6-6,3-7) xlab-b titleGrob[axis.title.x.bottom..titleGrob.31426]
15 6 (4-4,1-1) ylab-l titleGrob[axis.title.y.left..titleGrob.31429]
16 7 (4-4,9-9) ylab-r zeroGrob[NULL]
When it is first defined, it’s only a partially complete representation of the plot - title, legend, margins, etc. are missing:
Recall that plot_table
is the output of layout$render
:
legend_box <- plot$guides$assemble(theme)
This is the load-bearing step that computes/defines a bunch of smaller components internally:
<ggproto method>
<Wrapper function>
function (...)
render(..., self = self)
<Inner function (f)>
function (self, panels, data, theme, labels)
{
facet_bg <- self$facet$draw_back(data, self$layout, self$panel_scales_x,
self$panel_scales_y, theme, self$facet_params)
facet_fg <- self$facet$draw_front(data, self$layout, self$panel_scales_x,
self$panel_scales_y, theme, self$facet_params)
panels <- lapply(seq_along(panels[[1]]), function(i) {
panel <- lapply(panels, `[[`, i)
panel <- c(facet_bg[i], panel, facet_fg[i])
coord_fg <- self$coord$render_fg(self$panel_params[[i]],
theme)
coord_bg <- self$coord$render_bg(self$panel_params[[i]],
theme)
if (isTRUE(theme$panel.ontop)) {
panel <- c(panel, list(coord_bg), list(coord_fg))
}
else {
panel <- c(list(coord_bg), panel, list(coord_fg))
}
ggname(paste("panel", i, sep = "-"), gTree(children = inject(gList(!!!panel))))
})
plot_table <- self$facet$draw_panels(panels, self$layout,
self$panel_scales_x, self$panel_scales_y, self$panel_params,
self$coord, data, theme, self$facet_params)
labels <- self$coord$labels(list(x = self$resolve_label(self$panel_scales_x[[1]],
labels), y = self$resolve_label(self$panel_scales_y[[1]],
labels)), self$panel_params[[1]])
labels <- self$render_labels(labels, theme)
self$facet$draw_labels(plot_table, self$layout, self$panel_scales_x,
self$panel_scales_y, self$panel_params, self$coord, data,
theme, labels, self$params)
}
We can inspect these individual components:
[[1]]
zeroGrob[NULL]
[[2]]
zeroGrob[NULL]
[[1]]
zeroGrob[NULL]
[[2]]
zeroGrob[NULL]
[[1]]
gTree[panel-1.gTree.31513]
[[2]]
gTree[panel-2.gTree.31527]
TableGrob (4 x 7) "layout": 12 grobs
z cells name grob
1 1 (3-3,2-2) panel-1-1 gTree[panel-1.gTree.31513]
2 1 (3-3,6-6) panel-2-1 gTree[panel-2.gTree.31527]
3 3 (1-1,2-2) axis-t-1-1 zeroGrob[NULL]
4 3 (1-1,6-6) axis-t-2-1 zeroGrob[NULL]
5 3 (4-4,2-2) axis-b-1-1 absoluteGrob[GRID.absoluteGrob.31530]
6 3 (4-4,6-6) axis-b-2-1 absoluteGrob[GRID.absoluteGrob.31530]
7 3 (3-3,5-5) axis-l-1-2 zeroGrob[NULL]
8 3 (3-3,1-1) axis-l-1-1 absoluteGrob[GRID.absoluteGrob.31536]
9 3 (3-3,7-7) axis-r-1-2 zeroGrob[NULL]
10 3 (3-3,3-3) axis-r-1-1 zeroGrob[NULL]
11 2 (2-2,2-2) strip-t-1-1 gtable[strip]
12 2 (2-2,6-6) strip-t-2-1 gtable[strip]
$x
$x[[1]]
zeroGrob[NULL]
$x[[2]]
titleGrob[axis.title.x.bottom..titleGrob.31586]
$y
$y[[1]]
titleGrob[axis.title.y.left..titleGrob.31589]
$y[[2]]
zeroGrob[NULL]
19.3.1.1 Sneak peak:
The rest of the gtable step is just updating this plot_table
object.
all_plot_table_versions <- ggtrace_inspect_vars(
x = p, method = ggplot2:::ggplot_gtable.ggplot_built,
at = "all", vars = "plot_table"
)
names(all_plot_table_versions)
[1] "Step8" "Step10" "Step22" "Step23" "Step24" "Step25" "Step26" "Step27"
[9] "Step28" "Step29" "Step30" "Step31" "Step32" "Step33" "Step34"
lapply(seq_along(all_plot_table_versions), function(i) {
ggsave(tempfile(sprintf("plot_table_%02d_", i), fileext = ".png"), all_plot_table_versions[[i]])
})
dir(tempdir(), "plot_table_.*png", full.names = TRUE) %>%
magick::image_read() %>%
magick::image_annotate(names(all_plot_table_versions), location = "+1050+0", size = 100) %>%
magick::image_write_gif("images/plot_table_animation1.gif", delay = .5)
all_plot_table_versions2 <- ggtrace_inspect_vars(
x = p +
labs(
subtitle = "This is a subtitle",
caption = "@yjunechoe",
tag = "A"
)
,
method = ggplot2:::ggplot_gtable.ggplot_built,
at = "all", vars = "plot_table"
)
identical(names(all_plot_table_versions), names(all_plot_table_versions2))
lapply(seq_along(all_plot_table_versions2), function(i) {
ggsave(tempfile(sprintf("plot_table2_%02d_", i), fileext = ".png"), all_plot_table_versions2[[i]])
})
dir(tempdir(), "plot_table2_.*png", full.names = TRUE) %>%
magick::image_read() %>%
magick::image_annotate(names(all_plot_table_versions), location = "+1050+0", size = 100) %>%
magick::image_write_gif("images/plot_table_animation2.gif", delay = .5)
19.3.2 Adding guides
The legend (legend_box
) is first defined in Step 11:
title_height <- grobHeight(title)
legend_box <- ggtrace_inspect_vars(
x = p, method = ggplot2:::ggplot_gtable.ggplot_built,
at = 12, vars = "legend_box"
)
grid.newpage()
grid.draw(legend_box)
It then undergoes some edits/tweaks, including resolving the legend.position
theme setting, and then finally gets added to the plot in Step 15:
caption_height <- grobHeight(caption)
p_with_legend <- ggtrace_inspect_vars(
x = p, method = ggplot2:::ggplot_gtable.ggplot_built,
at = 16, vars = "plot_table"
)
grid.newpage()
grid.draw(p_with_legend)
The bulk of the work was done in Step 11, with the build_guides()
function. That in turn calls guides_train()
and guides_gengrob()
which in turn calls guide_train()
and guide_gengrob
for each scale (including positional aesthetics like x and y).
Why scale? The scale is actually what holds information about guide. They’re two sides of the same coin - the scale translates the underlying data to some defined space, and the guide reverses that (translates a space to data). One’s for drawing, the other is for reading.
This is also why all scale_*()
functions take a guide
argument. Positional scales use guide_axis()
as default, and non-positional scales use guide_legend()
as default.
[1] "GuideLegend" "Guide" "ggproto" "gg"
This is the output of the guide_train()
method defined for guide_legend()
. The most important piece of it is key
, which is the data associated with the legend.
# TODO: The unexported function no longer exists, so we had to turn off eval.
names( ggtrace_inspect_return(p, ggplot2:::guide_train.legend) )
ggtrace_inspect_return(p, ggplot2:::guide_train.legend)$key
The output of guide_train()
is passed to guide_gengrob()
. This is the output of the guide_gebgrob()
method defined for guide_legend()
:
19.3.3 Adding adornment
It’s everything else after the legend step that we saw in the gifs above. It looks trivial but this step we’re glossing over is ~150 lines of code. But it’s not super complicated - just a lot of if-else statements and a handful of low-level {grid} and {gtable} functions.