17.1 Theme
Plots can be customized by adding these function to your plot:
- scale_fill/color_
- theme_
- theme()
- …
17.1.1 Complete themes
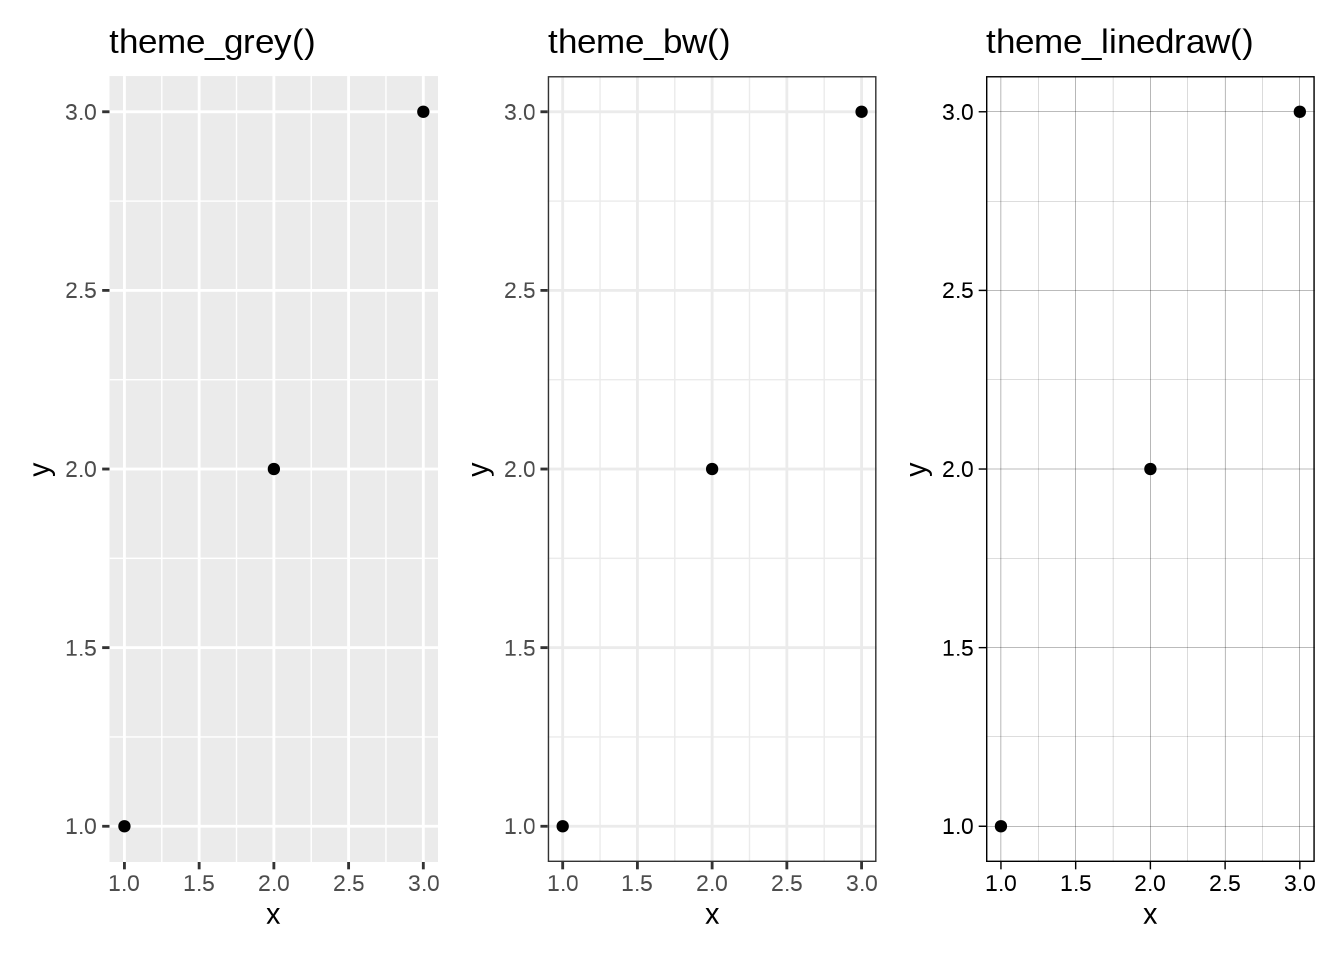
In ggplo2 there are preset themes ready to use:
library(tidyverse)
df <- data.frame(x = 1:3, y = 1:3)
base <- ggplot(df, aes(x, y)) + geom_point()
p1<-base + theme_grey() + ggtitle("theme_grey()")
p2<-base + theme_bw() + ggtitle("theme_bw()")
p3<-base + theme_linedraw() + ggtitle("theme_linedraw()")

library(patchwork)
p1+p2+p3
p4<-base + theme_light() + ggtitle("theme_light()")
p5<- base + theme_dark() + ggtitle("theme_dark()")
p6<-base + theme_minimal()  + ggtitle("theme_minimal()")

p4+p5+p6
p7<-base + theme_classic() + ggtitle("theme_classic()")
p8<-base + theme_void() + ggtitle("theme_void()")

p7+p8
Or, you can use other packages such as {ggthemes} or other here: ggplot extension gallery
library(ggthemes)
p9<-base + theme_tufte() + ggtitle("theme_tufte()")
p10<-base + theme_solarized() + ggtitle("theme_solarized()")
p11<-base + theme_excel() + ggtitle("theme_excel()")

p9+p10+p11
- Modifying complete theme components with
theme()function