Specifying a layout
Basic requirements:
The data frame needs to have at least an x and y column and the same number of rows as there are nodes in the input graph.
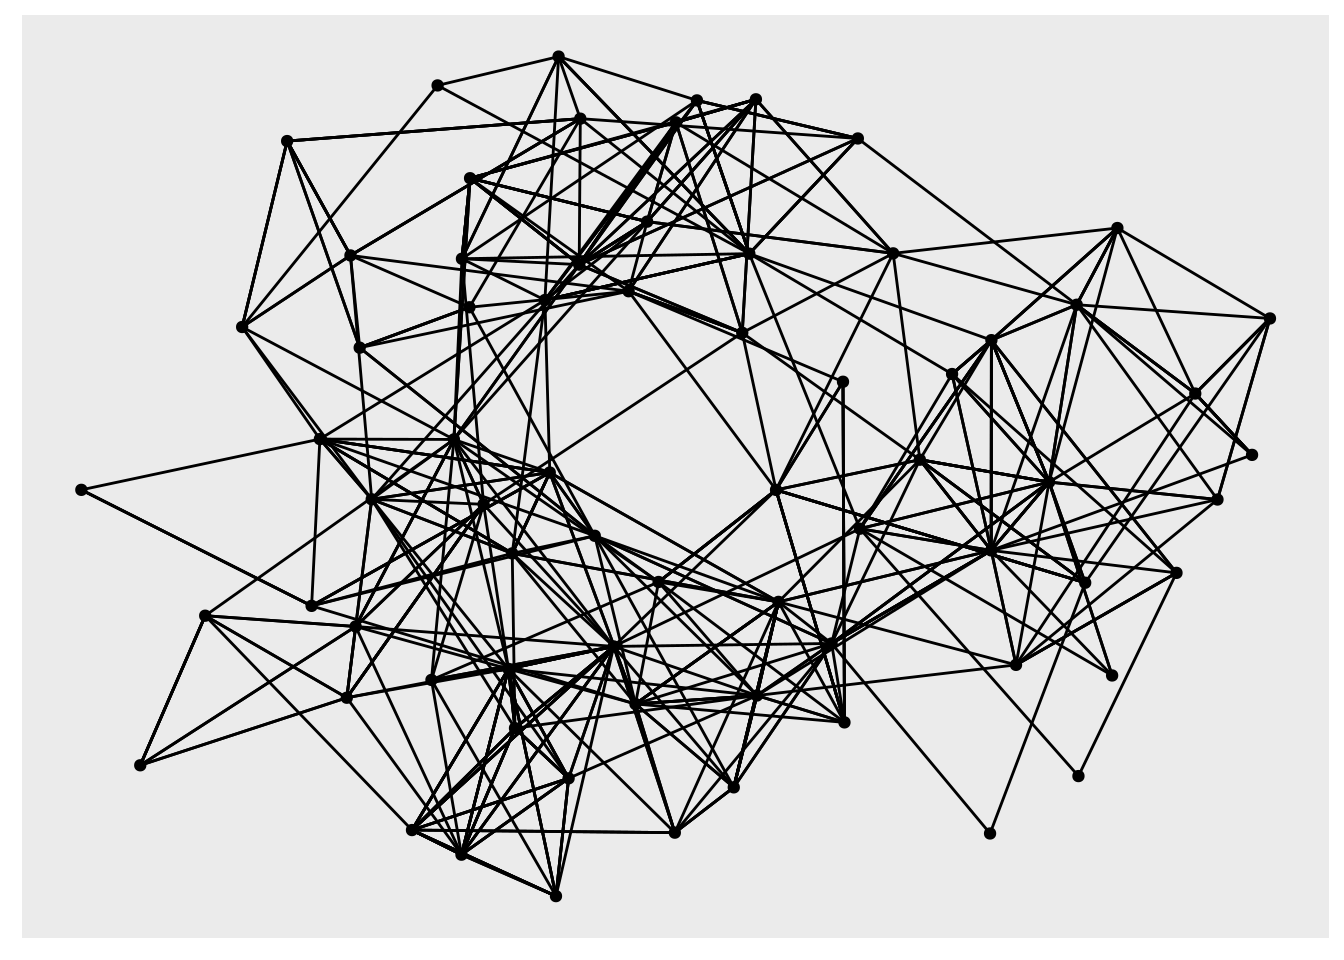
As an example we take the data(highschool, package = "ggraph") and make a visualization of the graph:
library(ggraph)
ggraph(hs_graph) +
  geom_edge_link() +
  geom_node_point()