16.4 Controlling scales
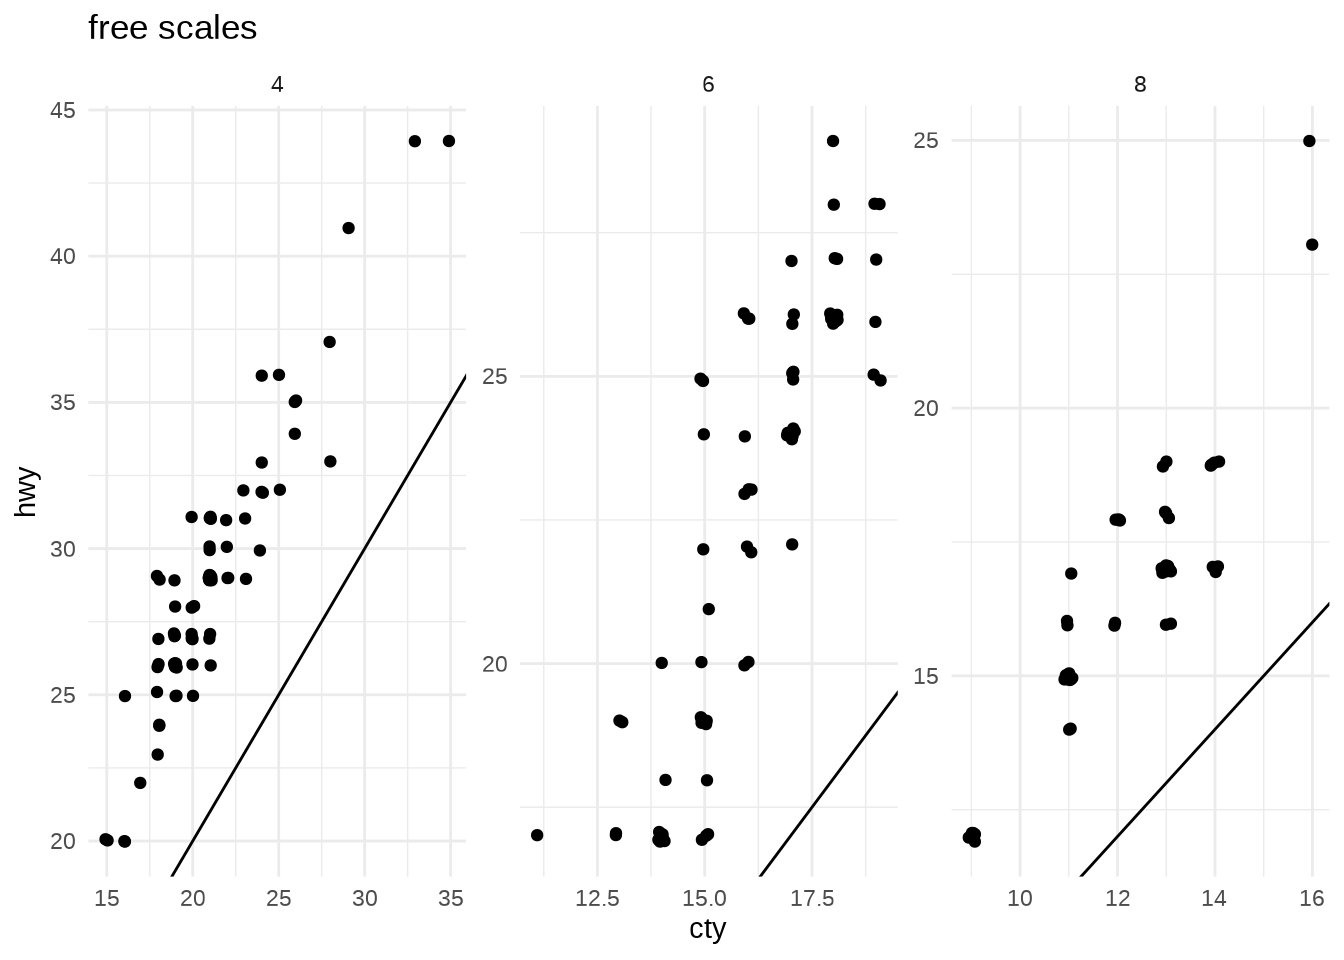
The scales parameter can be used to control whether the position scales are the same in all panels (fixed) or allowed to vary between panels (free).
scales = "fixed": x and y scales are fixed across all panels.scales = "free_x": the x scale is free, and the y scale is fixed.scales = "free_y": the y scale is free, and the x scale is fixed.scales = "free": x and y scales vary across panels.
p <- ggplot(mpg2, aes(cty, hwy)) +
  geom_abline() + # I think this defaults to a default of intercept = 0 and slope = 1?
  geom_jitter(width = 0.1, height = 0.1)

p + facet_wrap(~cyl) + labs(title = "default (fixed scales)")

Free scales can be especially useful when comparing multiple time series measured on different scales.
# A tibble: 574 × 2
   date           n
   <date>     <int>
 1 1967-07-01     5
 2 1967-08-01     5
 3 1967-09-01     5
 4 1967-10-01     5
 5 1967-11-01     5
 6 1967-12-01     5
 7 1968-01-01     5
 8 1968-02-01     5
 9 1968-03-01     5
10 1968-04-01     5
# ℹ 564 more rowsggplot(economics_long, aes(date, value)) +
geom_line() +
facet_wrap(~variable, scales = "free_y", ncol = 1)