Facet grid
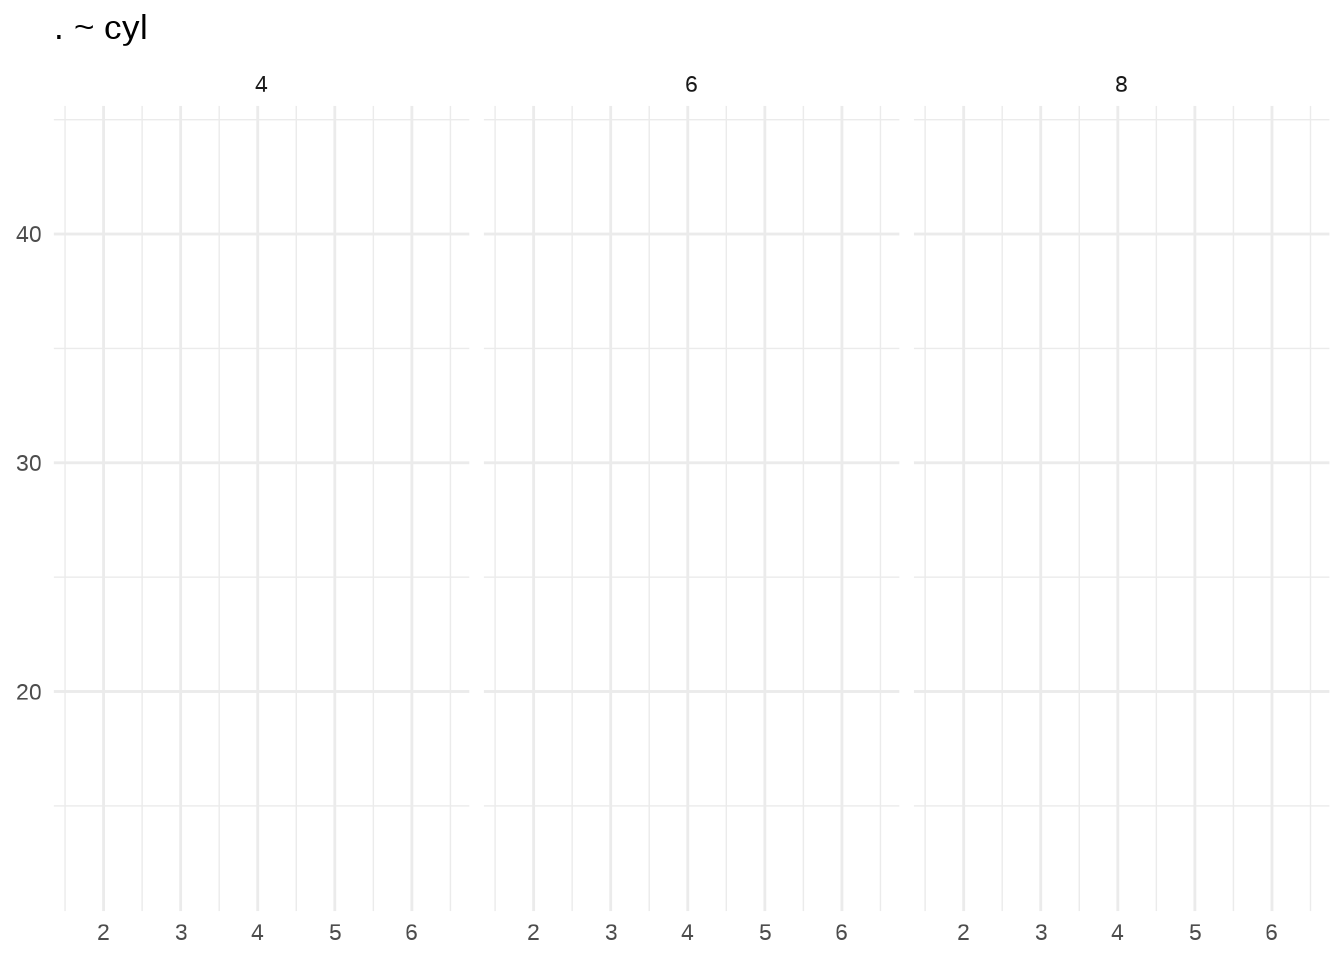
facet_grid() uses a formula (y ~ x) to lay out plots in a 2-dimensional grid. This can be useful to compare across combinations of variables.
base + facet_grid(. ~ cyl) + labs(title = ". ~ cyl")
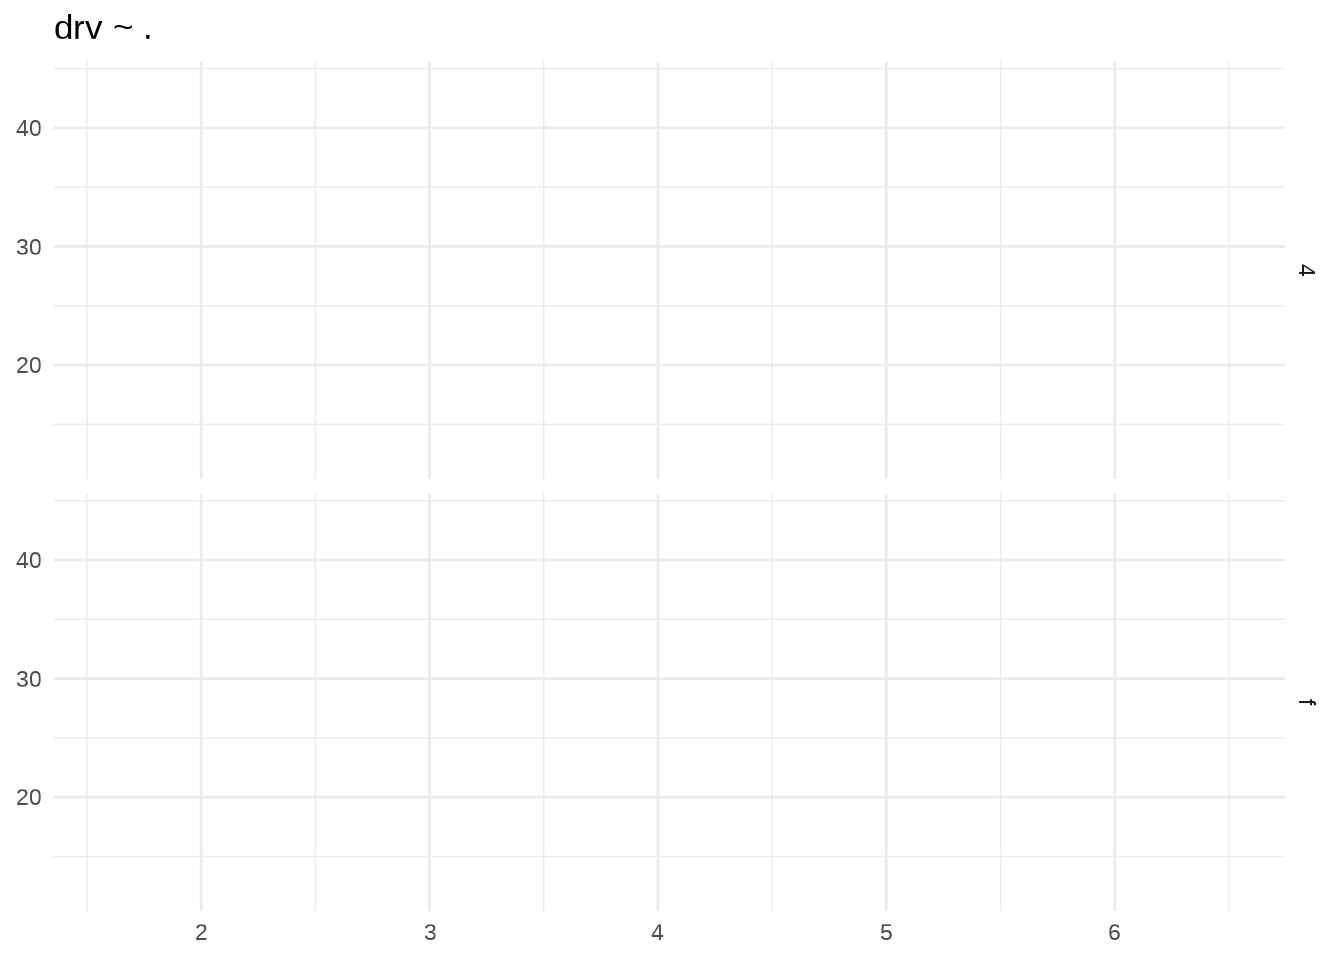
base + facet_grid(drv ~ .) + labs(title = "drv ~ .")
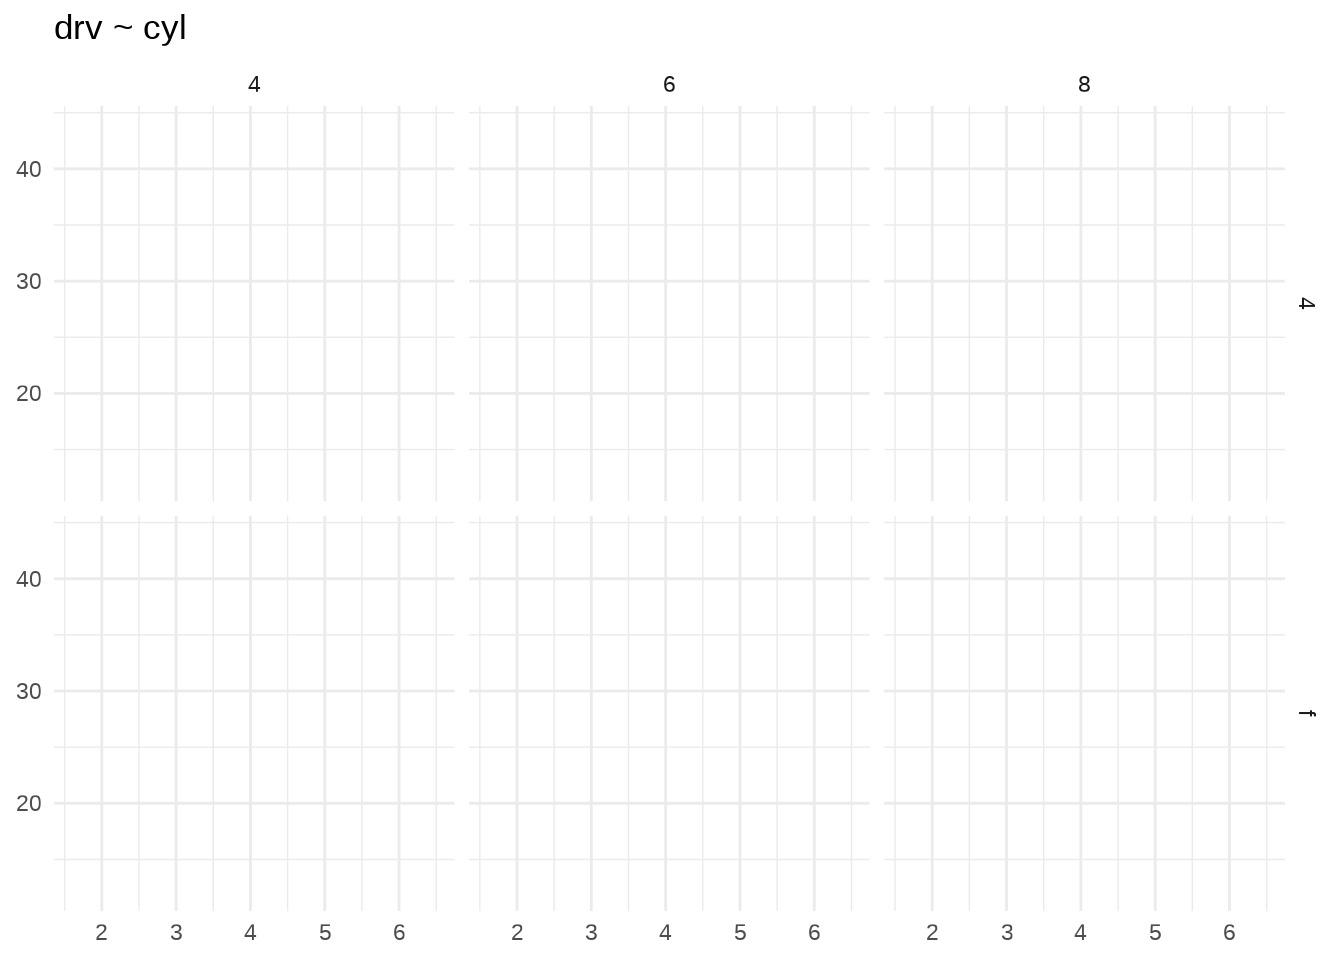
base + facet_grid(drv ~ cyl) + labs(title = "drv ~ cyl")
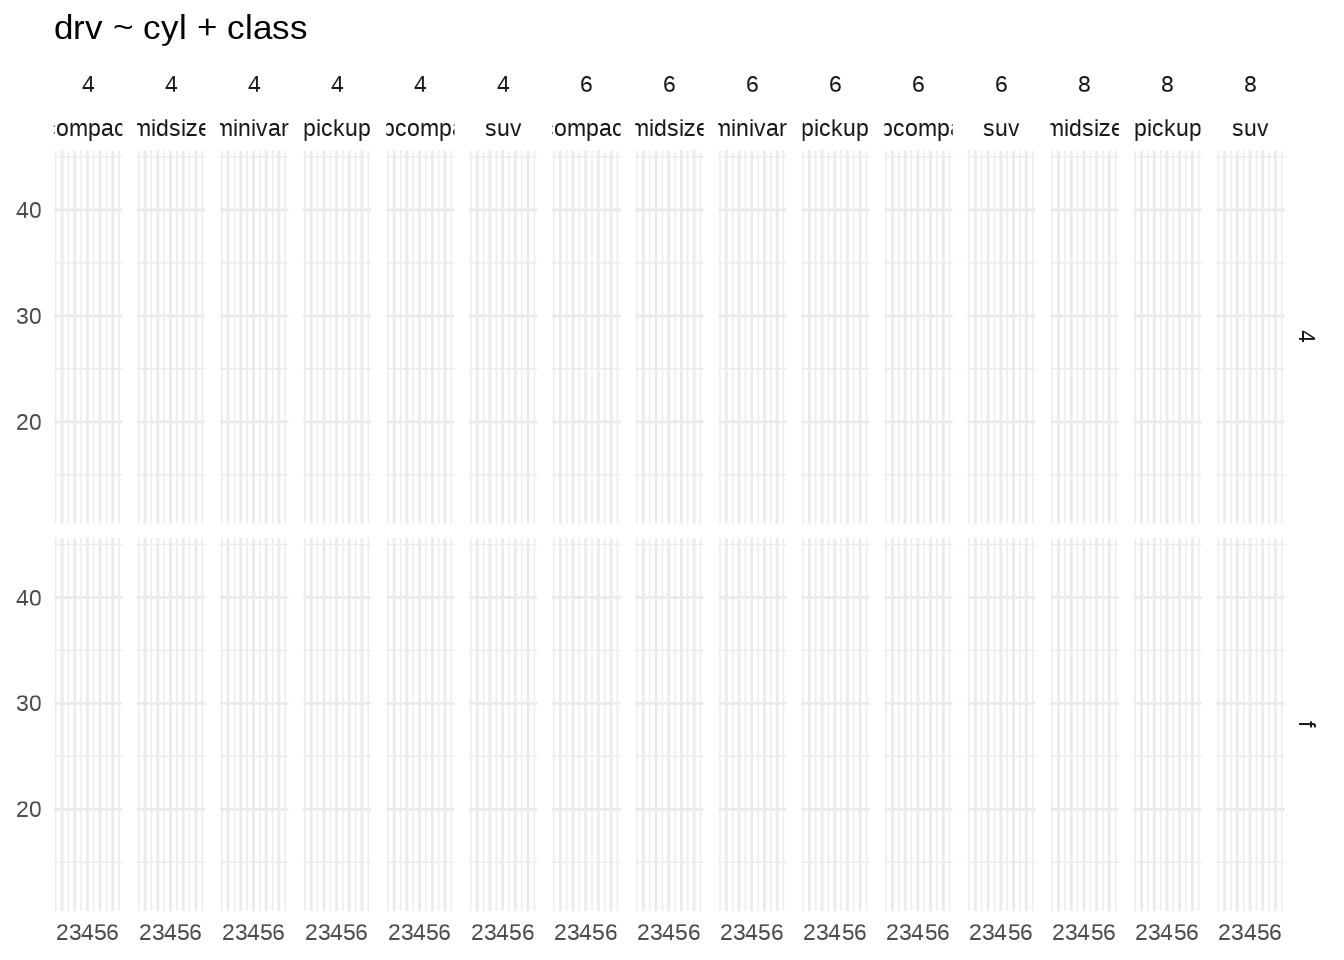
Use multiple variables in the rows and columns by “adding” them: a + b ~ c + d
Variables specified on rows and columns will be crossed.
base + facet_grid(drv ~ cyl + class) + labs(title = "drv ~ cyl + class")