Simplifying Lines
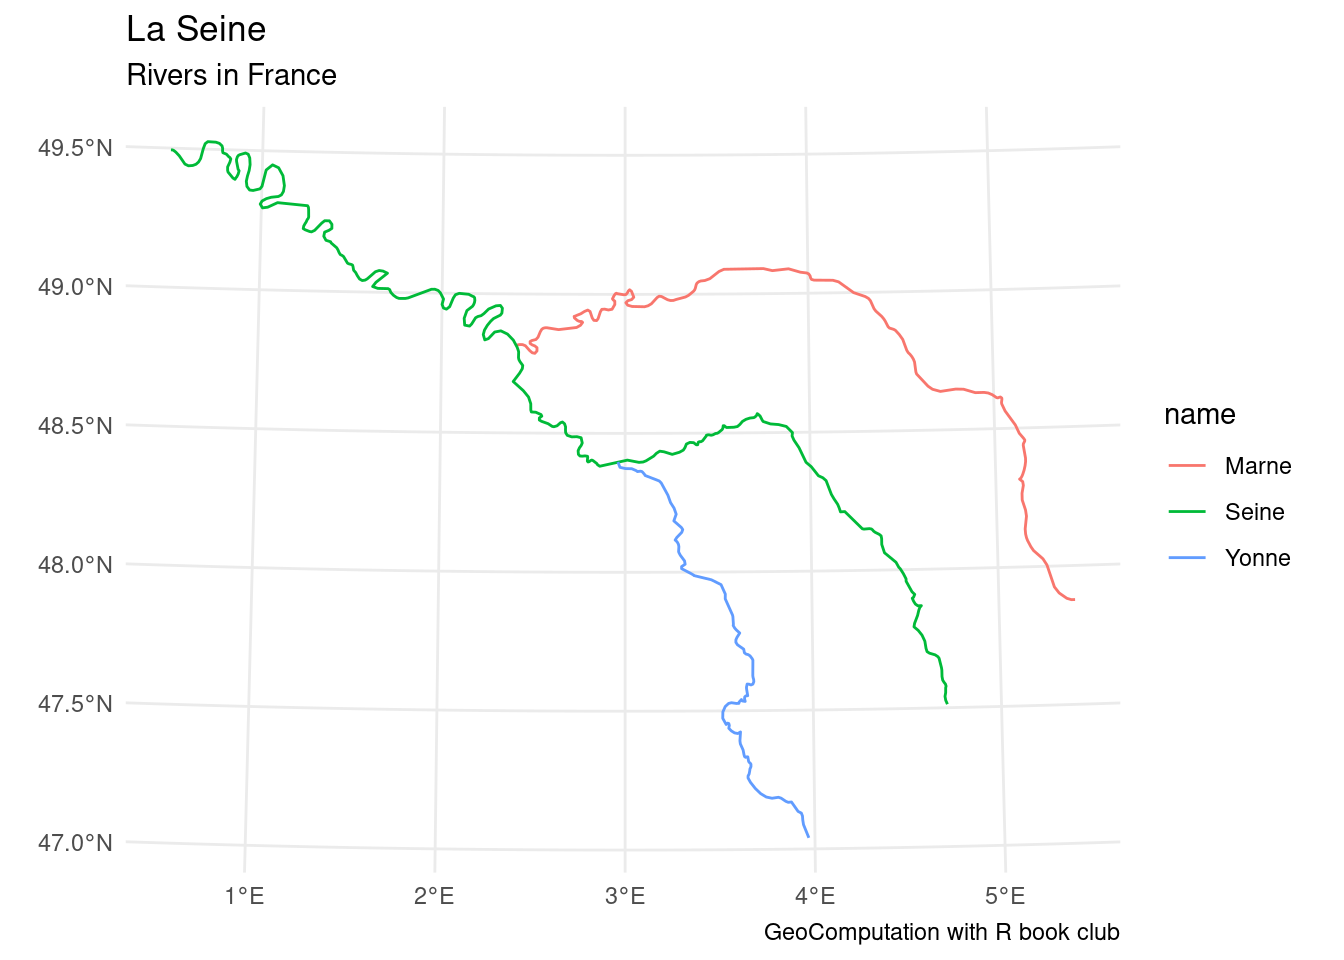
# original data
seine |>
  ggplot() +
  geom_sf(aes(color = name)) +
  labs(title = "La Seine",
       subtitle = "Rivers in France",
       caption = "GeoComputation with R book club") +
  theme_minimal()
seine_simp_1000 = st_simplify(seine, dTolerance = 1000)  #1000 meters
seine_simp_1000 |>
  ggplot() +
  geom_sf() +
  labs(title = "La Seine",
       subtitle = "resolution: 1000 meters",
       caption = "GeoComputation with R book club") +
  theme_minimal()


## 18096 bytes
object.size(seine_simp_1000)
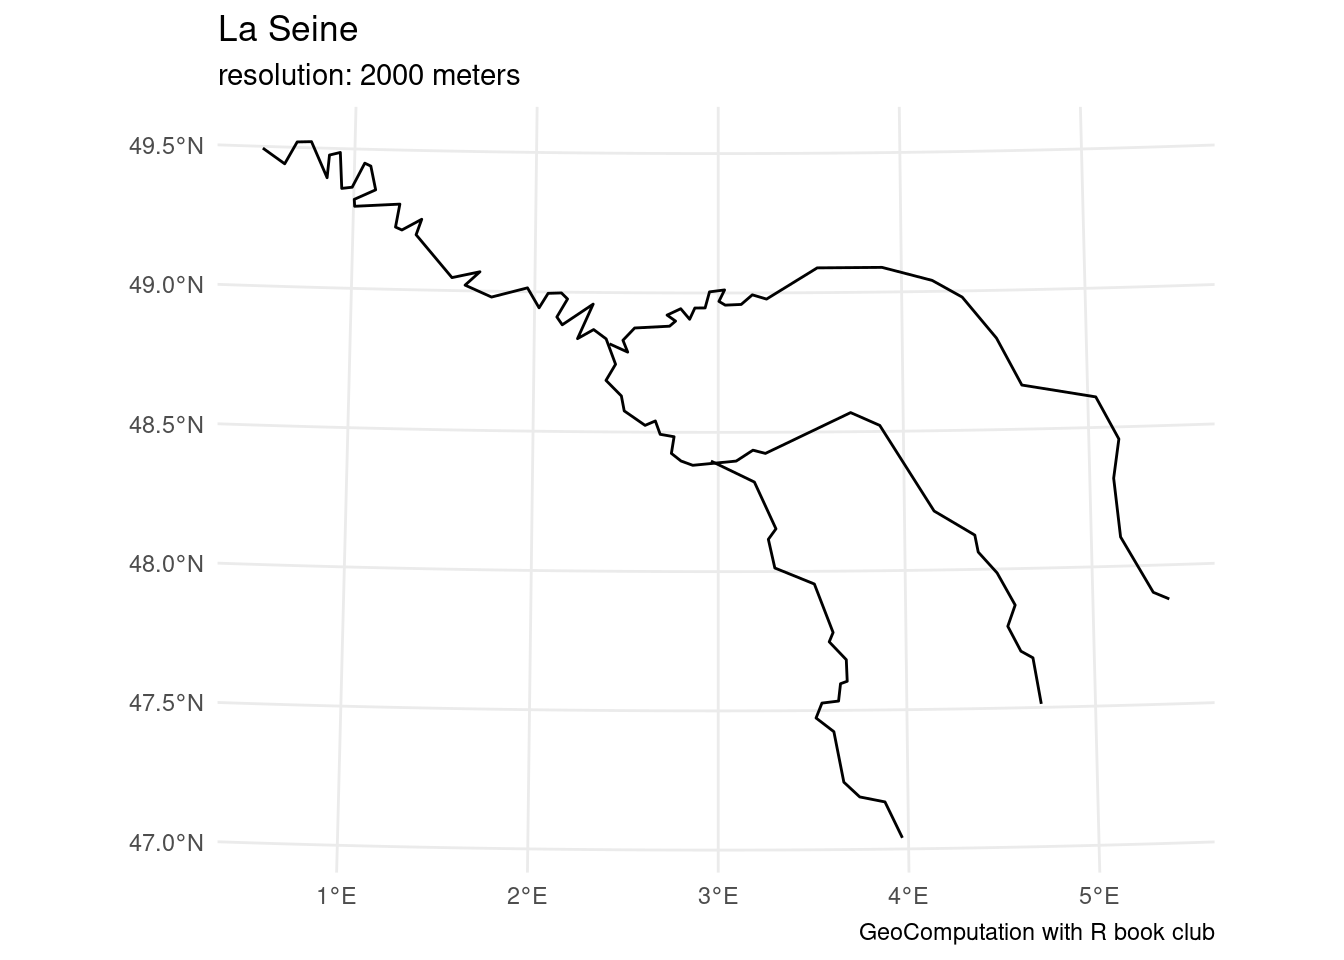
## 10280 bytes
object.size(seine_simp_2000)
## 9112 bytes
object.size(seine_simp_4000)
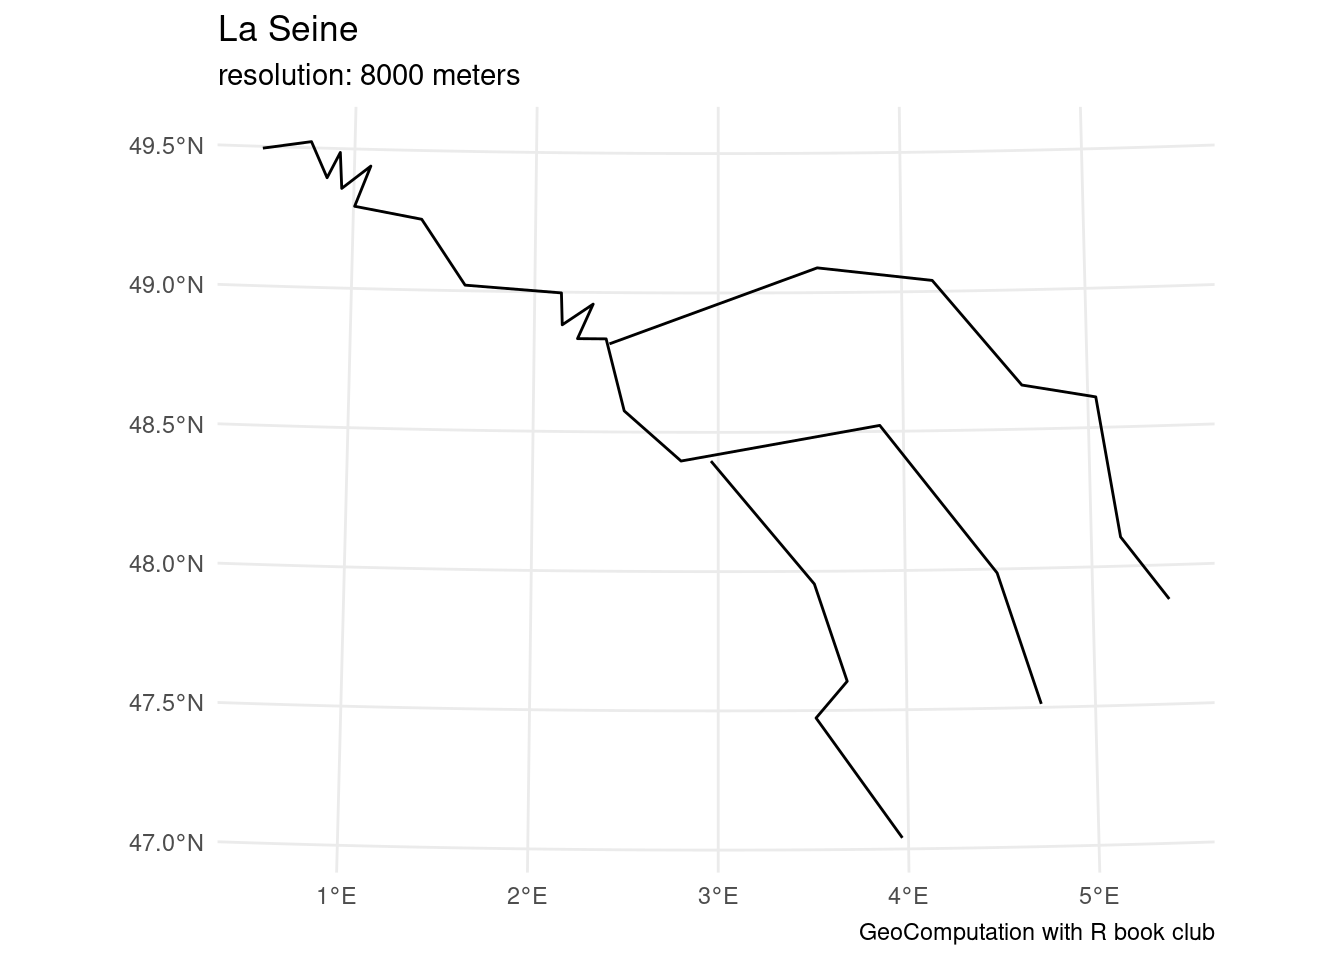
## 8408 bytes
object.size(seine_simp_8000)
## 7944 bytes