9.10 Interactive Maps
tmap_mode("view") # or use tmap_leaflet()## tmap mode set to interactive viewingmap_nz3## stars object downsampled to 877 by 1140 cells. See tm_shape manual (argument raster.downsample)map_nz + tm_basemap(server = "OpenTopoMap")world_coffee = left_join(world, coffee_data, by = "name_long")
facets = c("coffee_production_2016", "coffee_production_2017")
tm_shape(world_coffee) + tm_polygons(facets) +
tm_facets(nrow = 1, sync = TRUE)# restore static plot default
tmap_mode("plot")## tmap mode set to plotting9.10.1 Mapview
mapview::mapview(nz)Consider the following example where sf is used to intersect lines and polygons and then is visualized with mapview
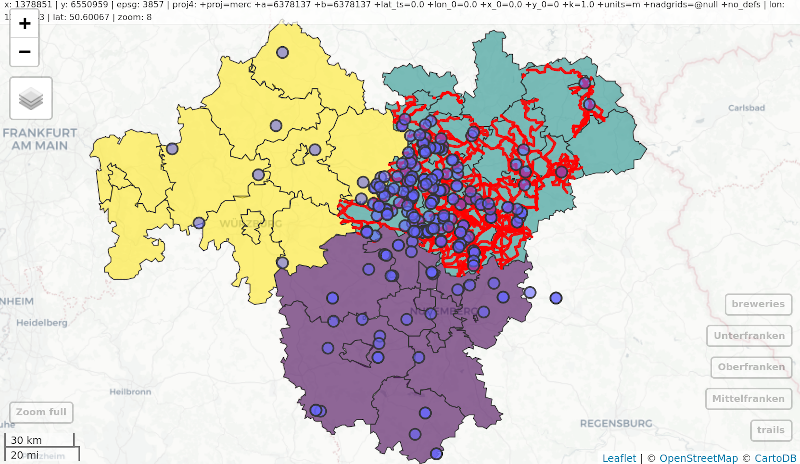
Mapview example
9.10.2 Mapdeck
A unique feature of mapdeck is its provision of interactive ‘2.5d’ perspectives
Mapdeck example
9.10.3 Leaflet
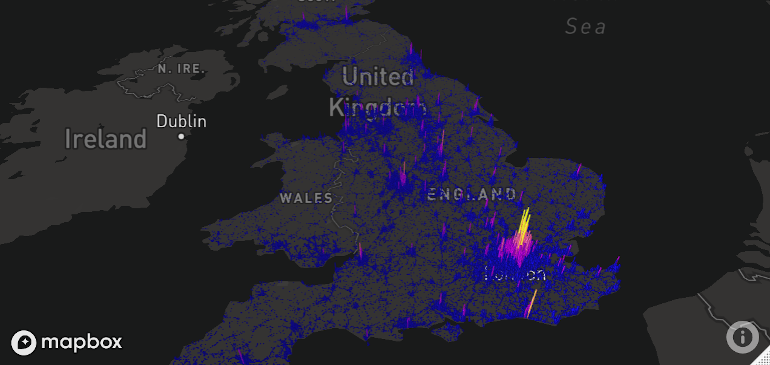
leaflet which is the most mature and widely used interactive mapping package in R. leaflet provides a relatively low-level interface to the Leaflet JavaScript library. Here is the leaflet package in action, showing cycle hire points in London.
pal = colorNumeric("RdYlBu", domain = cycle_hire$nbikes)
leaflet(data = cycle_hire) |>
  addProviderTiles(providers$CartoDB.Positron) |>
  addCircles(col = ~pal(nbikes), opacity = 0.9) |>
  addPolygons(data = lnd, fill = FALSE) |>
  addLegend(pal = pal, values = ~nbikes) |>
  setView(lng = -0.1, 51.5, zoom = 12) |>
  addMiniMap()
FIGURE 9.23: The leaflet package in action, showing cycle hire points in London.