14.6 Identifying suitable locations
Our last step: add poi to the reclass raster stack and remove the population layer from it.
The reasoning: First of all, we have already delineated metropolitan areas, that is areas where the population density is above average compared to the rest of Germany.
Second, though it is advantageous to have many potential customers within a specific catchment area, the sheer number alone might not actually represent the desired target group. For instance, residential tower blocks are areas with a high population density but not necessarily with a high purchasing power for expensive cycle components.
reclass2 <- reclass[[names(reclass) != "pop"]] |>
  c(poi)

plot(reclass2)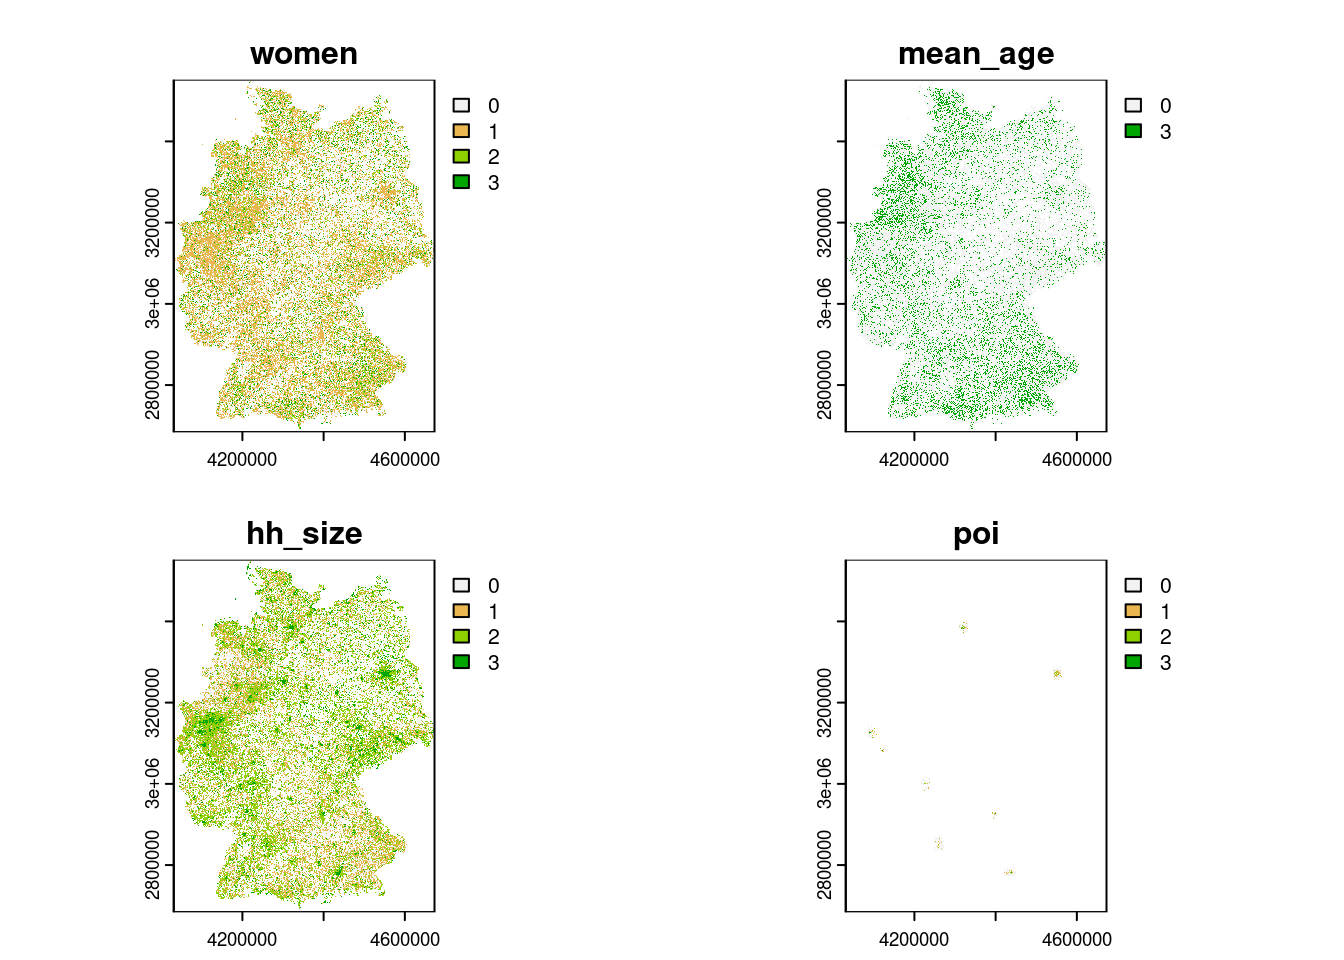
the final step — calculating a final score by summing the scoring across all of the raster layers
(result <- sum(reclass2))## class : SpatRaster
## dimensions : 868, 642, 1 (nrow, ncol, nlyr)
## resolution : 1000, 1000 (x, y)
## extent : 4031000, 4673000, 2684000, 3552000 (xmin, xmax, ymin, ymax)
## coord. ref. : ETRS89-extended / LAEA Europe (EPSG:3035)
## source(s) : memory
## name : sum
## min value : 0
## max value : 12# have a look at suitable bike shop locations in Berlin
berlin <- metros[metro_names == "Berlin", ]
berlin_raster <- terra::crop(result, berlin)
berlin_raster <- berlin_raster > 9
berlin_raster[berlin_raster == 0] = NA
mapviewOptions(fgb = FALSE)
mapview(raster::raster(berlin_raster), col.regions = c(NA, "darkgreen"),
na.color = "transparent", legend = TRUE, map.type = "OpenStreetMap")For instance, a score greater than 9 might be a suitable threshold indicating raster cells where a bike shop could be placed