12.6 GLM
# create spatial classification task
task = mlr3spatiotempcv::TaskClassifST$new(
  id = "ecuador_lsl",
  backend = mlr3::as_data_backend(lsl), # expects response and predictor vars
  target = "lslpts",
  positive = "TRUE",
  coordinate_names = c("x", "y"),
  coords_as_features = FALSE,
  crs = "EPSG:32717"
  )
# plot response against each predictor
mlr3viz::autoplot(task, type = "duo")## Registered S3 method overwritten by 'GGally':
## method from
## +.gg ggplot2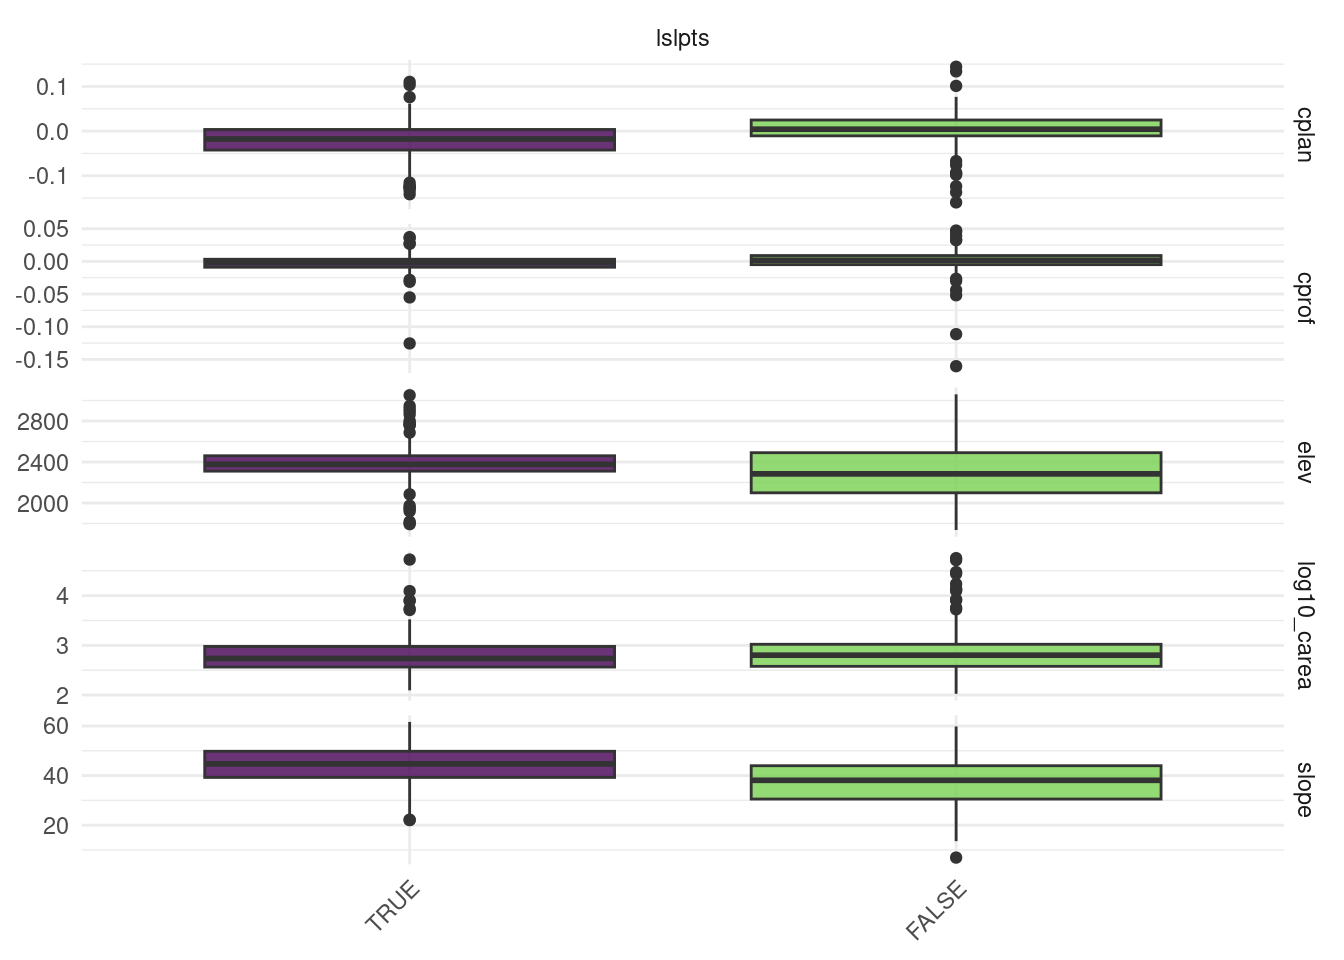
# plot all variables against each other (slightly long computation time)
mlr3viz::autoplot(task, type = "pairs")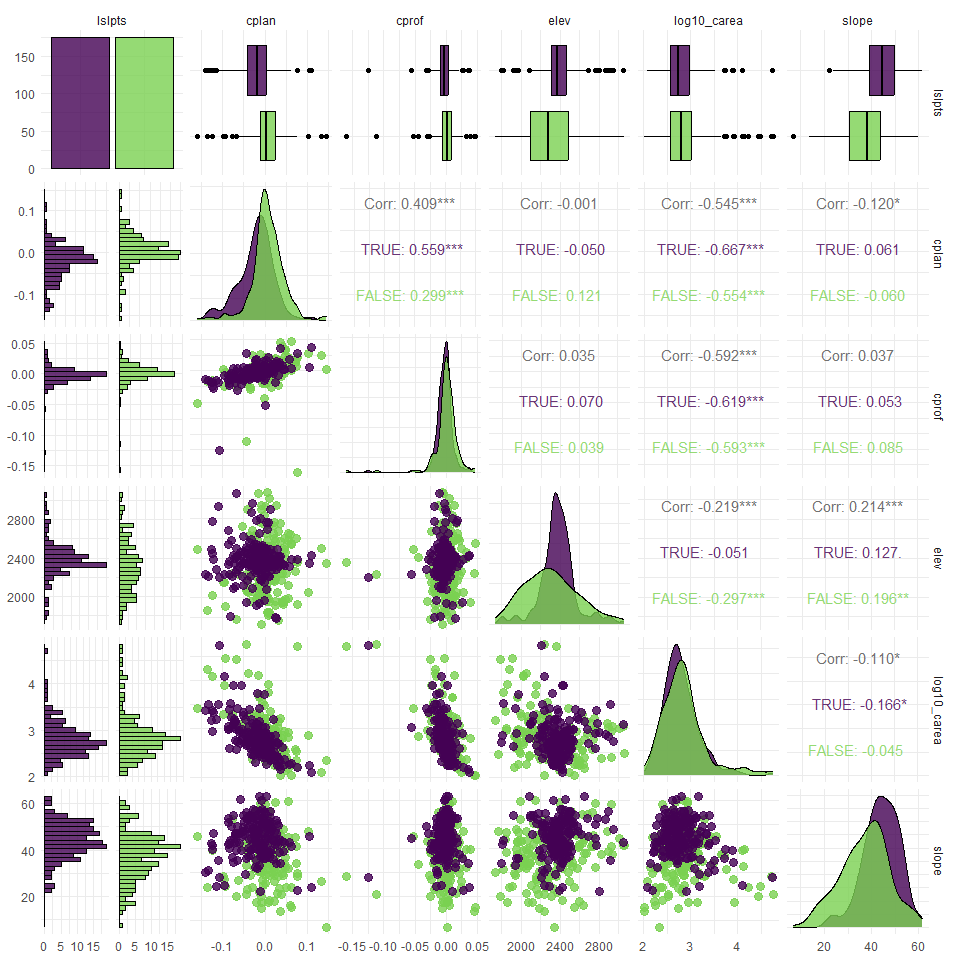
pairs plot
- The
mlr3extralearnerspackage contains more information (butmlr3extralearnerswas not currently available forR 4.3.0)
learner = mlr3::lrn("classif.log_reg", predict_type = "prob")
# learner$help()