14.3 Create census rasters
The x and y from the input file correspond to a 1000 x 1000 square meter unit grid.
(input_ras <- terra::rast(input_tidy, type = "xyz", crs = "EPSG:3035"))## class : SpatRaster
## dimensions : 868, 642, 4 (nrow, ncol, nlyr)
## resolution : 1000, 1000 (x, y)
## extent : 4031000, 4673000, 2684000, 3552000 (xmin, xmax, ymin, ymax)
## coord. ref. : ETRS89-extended / LAEA Europe (EPSG:3035)
## source(s) : memory
## names : pop, women, mean_age, hh_size
## min values : 1, 1, 1, 1
## max values : 6, 5, 5, 5ger <- geodata::gadm(country = "DEU", level = 0, path = tempdir())
ger <- st_as_sf(terra::project(ger, crs(input_ras)))
tm_shape(input_ras) +
tm_raster(style = "cat", palette = "GnBu", title = "Class") +
tm_facets(nrow = 1) +
tm_shape(ger) +
tm_borders() +
tm_layout(panel.labels = c("population", "women", "mean age", "household size"),
legend.outside.size = 0.08)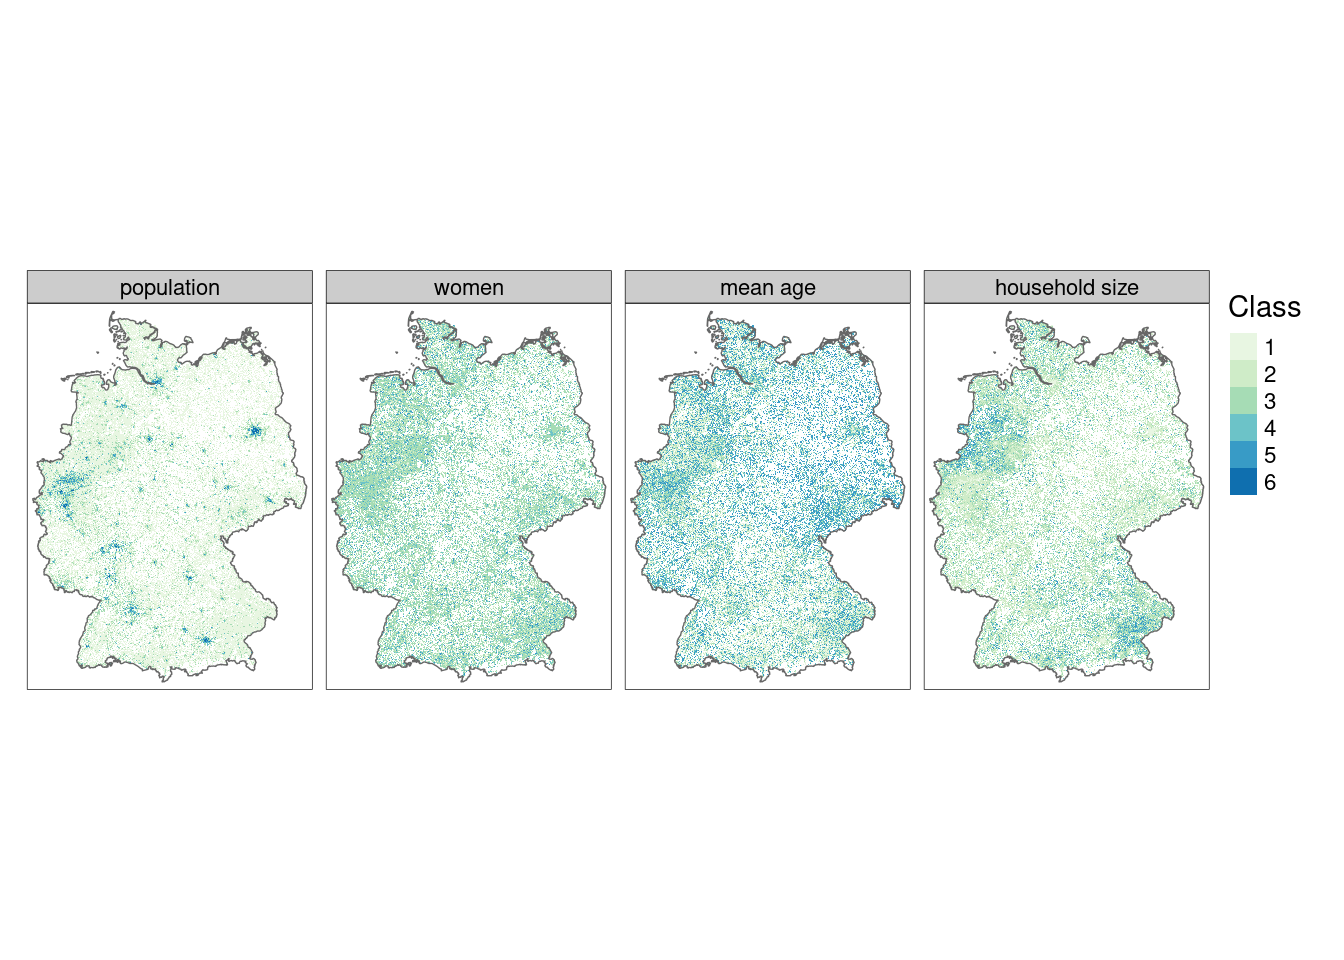
The next stage is to reclassify the values of the rasters stored in input_ras in accordance with the survey mentioned above, using the terra function classify()
In the case of the population data, we convert the classes into a numeric data type using class means.
Raster cells are assumed to have a population of 127 if they have a value of 1 (the middle of the categorical bin)
The remaining variables are re-classified as weights corresponding with weights used in the survey.
Class 1 in the variable women represents areas in which 0 to 40% of the population is female; these are reclassified with a comparatively high weight of 3 because the target demographic is predominantly male. Similarly, the classes containing the youngest people and highest proportion of single households are reclassified to have high weights.
rcl_pop <- matrix(c(1, 1, 127, 2, 2, 375, 3, 3, 1250,
                   4, 4, 3000, 5, 5, 6000, 6, 6, 8000),
                 ncol = 3, byrow = TRUE)

rcl_women <- matrix(c(1, 1, 3, 2, 2, 2, 3, 3, 1, 4, 5, 0),
                   ncol = 3, byrow = TRUE)

rcl_age <- matrix(c(1, 1, 3, 2, 2, 0, 3, 5, 0),
                 ncol = 3, byrow = TRUE)

rcl_hh <- rcl_women

rcl <- list(rcl_pop, rcl_women, rcl_age, rcl_hh)

reclass <- input_ras

for (i in seq_len(terra::nlyr(reclass))) {
  reclass[[i]] = terra::classify(x = reclass[[i]], rcl = rcl[[i]], right = NA)
}

names(reclass) <- names(input_ras)

reclass
## class : SpatRaster
## dimensions : 868, 642, 4 (nrow, ncol, nlyr)
## resolution : 1000, 1000 (x, y)
## extent : 4031000, 4673000, 2684000, 3552000 (xmin, xmax, ymin, ymax)
## coord. ref. : ETRS89-extended / LAEA Europe (EPSG:3035)
## source(s) : memory
## names : pop, women, mean_age, hh_size
## min values : 127, 0, 0, 0
## max values : 8000, 3, 3, 3