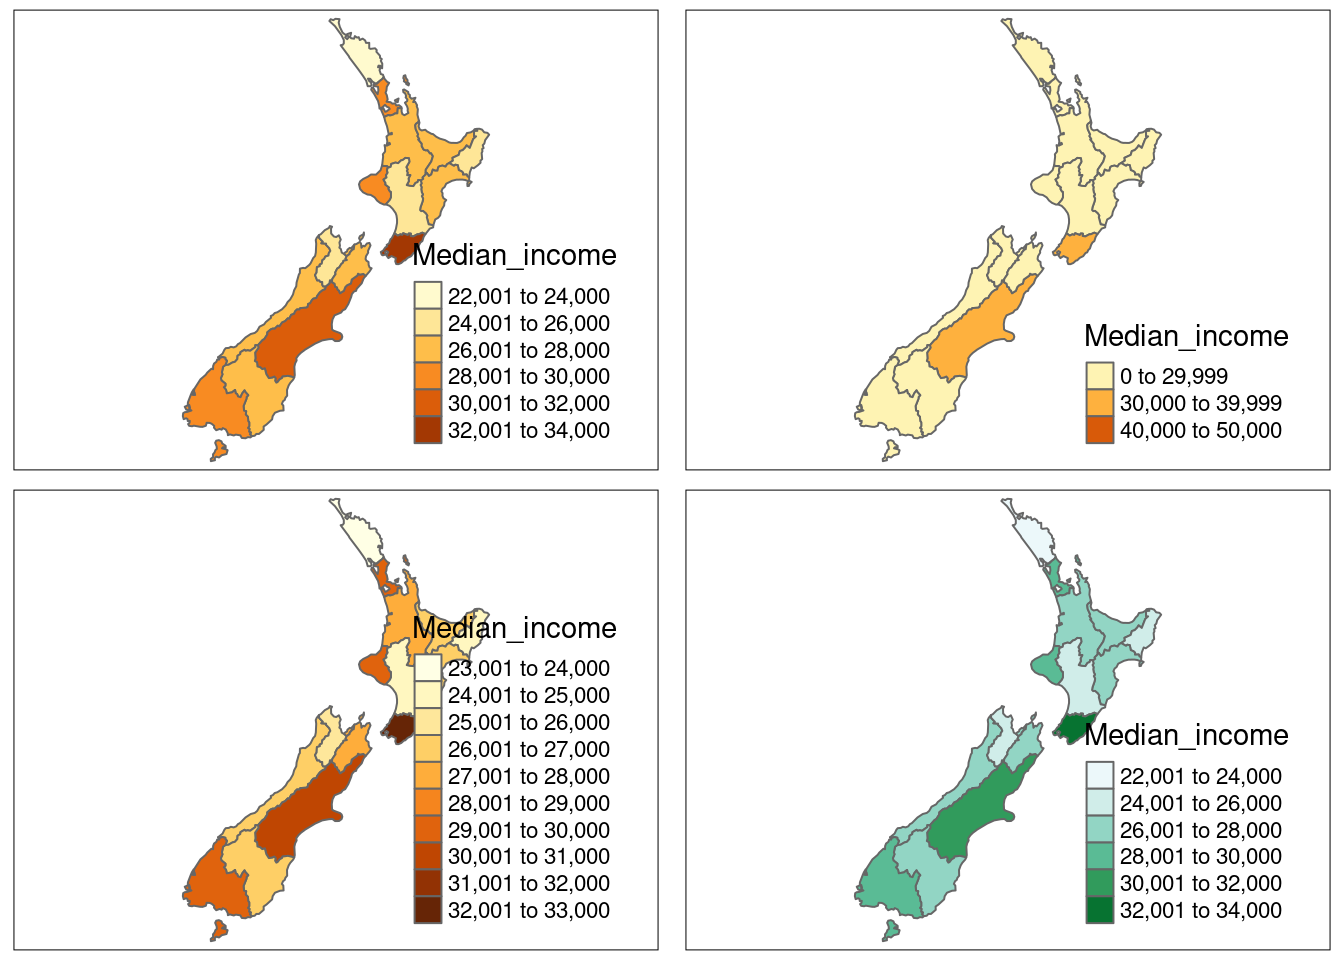
color_map1 <- tm_shape(nz) + tm_polygons(col = "Median_income")
breaks = c(0, 3, 4, 5) * 10000
color_map2 <- tm_shape(nz) +
  tm_polygons(col = "Median_income", breaks = breaks)
color_map3 <- tm_shape(nz) +
  tm_polygons(col = "Median_income", n = 10)
color_map4 <- tm_shape(nz) +
  tm_polygons(col = "Median_income", palette = "BuGn")
tmap_arrange(color_map1, color_map2, color_map3, color_map4)
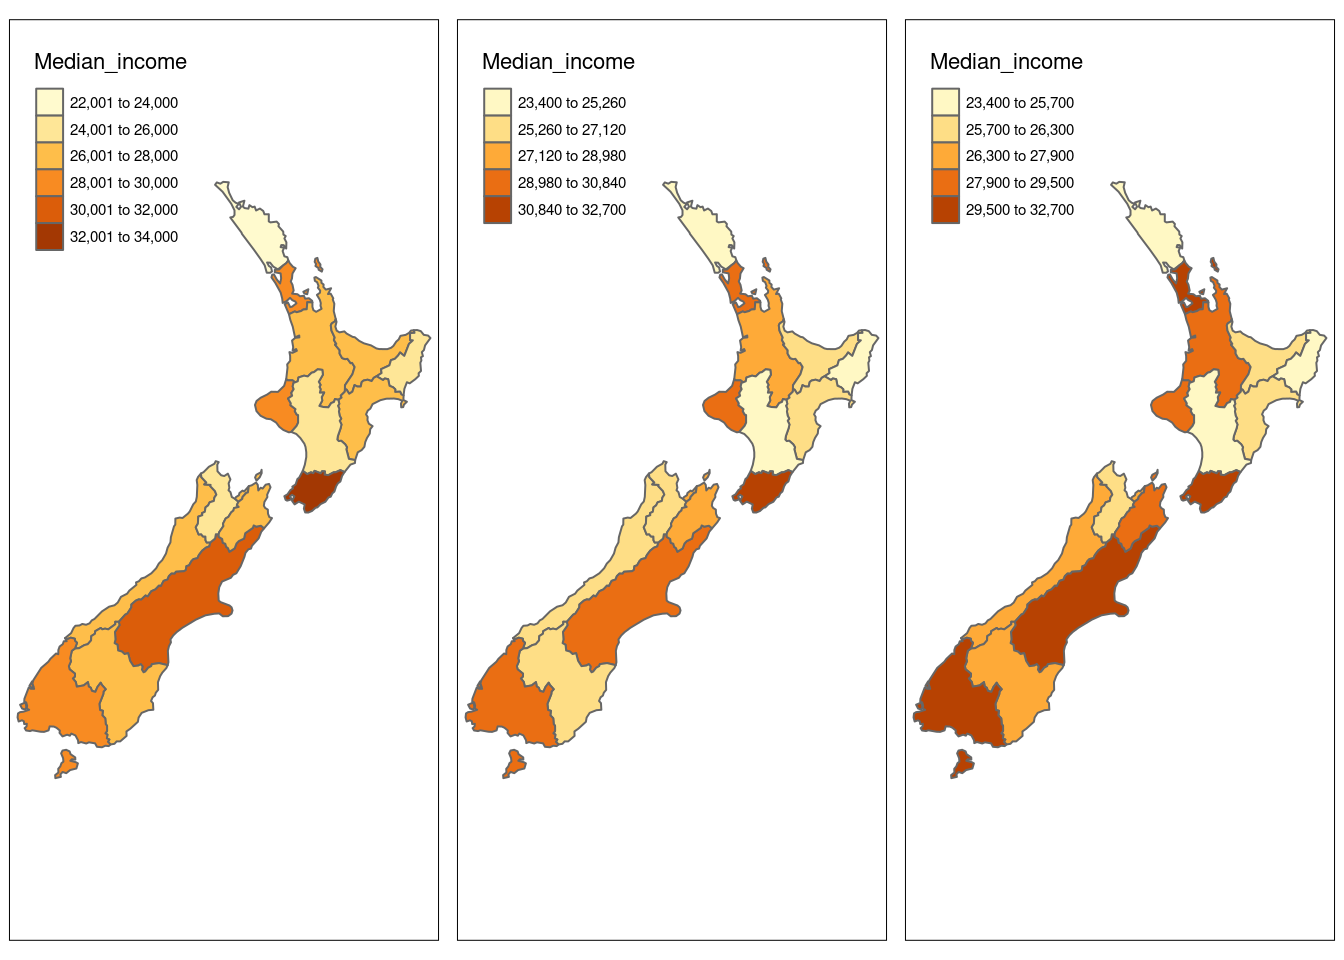
Breaks
breaks_map1 <- tm_shape(nz) +
tm_polygons(col = "Median_income", style = "pretty")
breaks_map2 <- tm_shape(nz) +
tm_polygons(col = "Median_income", style = "equal")
breaks_map3 <- tm_shape(nz) +
tm_polygons(col = "Median_income", style = "quantile")
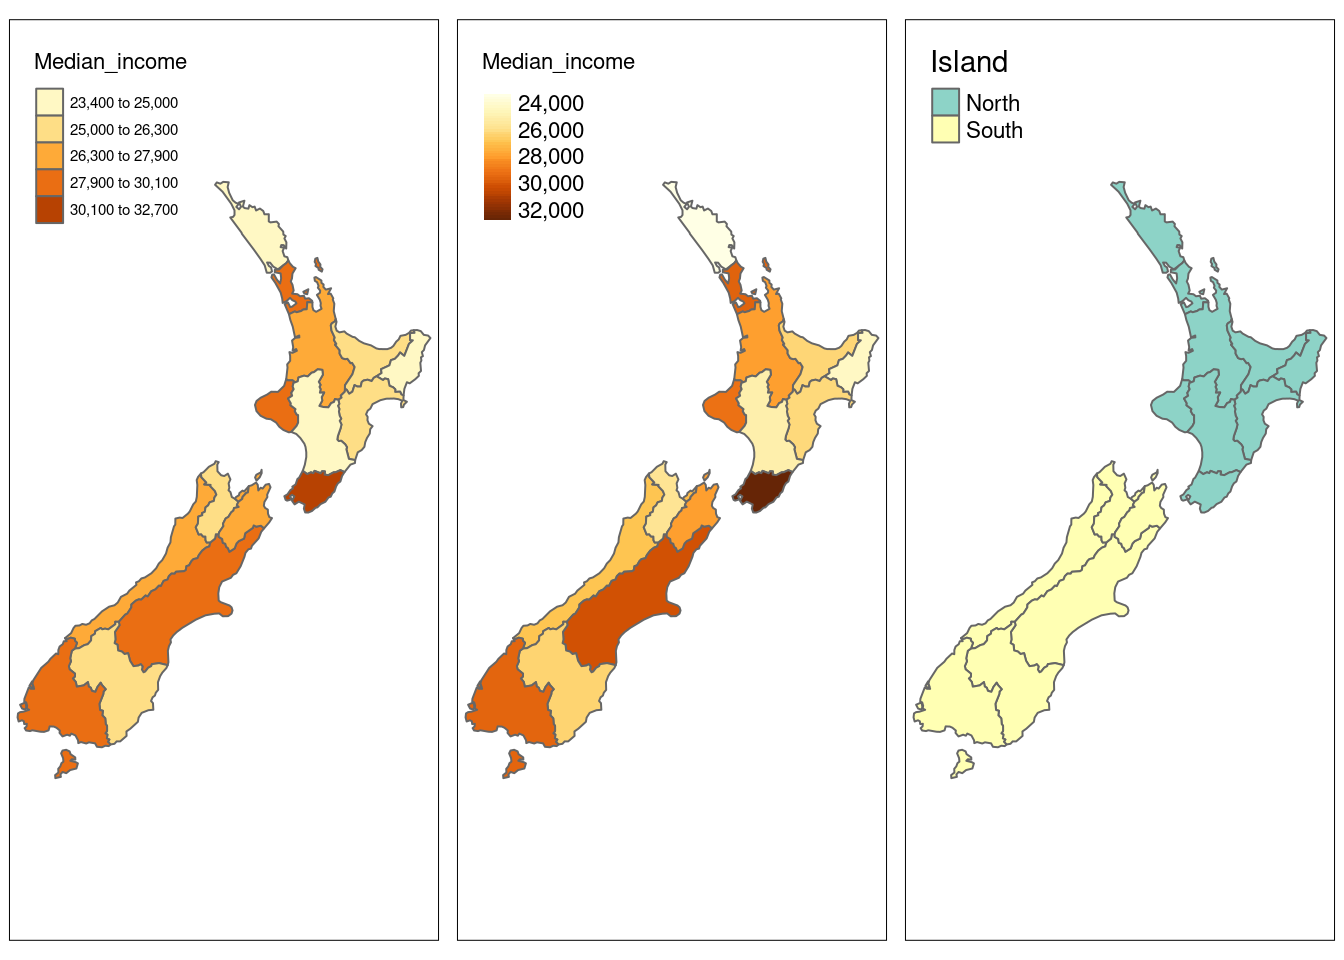
breaks_map4 <- tm_shape(nz) +
tm_polygons(col = "Median_income", style = "jenks")
breaks_map5 <- tm_shape(nz) +
tm_polygons(col = "Median_income", style = "cont")
breaks_map6 <- tm_shape(nz) +
tm_polygons(col = "Island", style = "cat")
tmap_arrange(breaks_map1, breaks_map2, breaks_map3)
tmap_arrange(breaks_map4, breaks_map5, breaks_map6)
Further details
style = "pretty", the default setting, rounds breaks into whole numbers where possible and spaces them evenly;style = "equal" divides input values into bins of equal range and is appropriate for variables with a uniform distribution (not recommended for variables with a skewed distribution as the resulting map may end-up having little color diversity);style = "quantile" ensures the same number of observations fall into each category (with the potential downside that bin ranges can vary widely);style = "jenks" identifies groups of similar values in the data and maximizes the differences between categories;style = "cont" (and “order”) present a large number of colors over continuous color fields and are particularly suited for continuous rasters (“order” can help visualize skewed distributions);style = "cat" was designed to represent categorical values and assures that each category receives a unique color
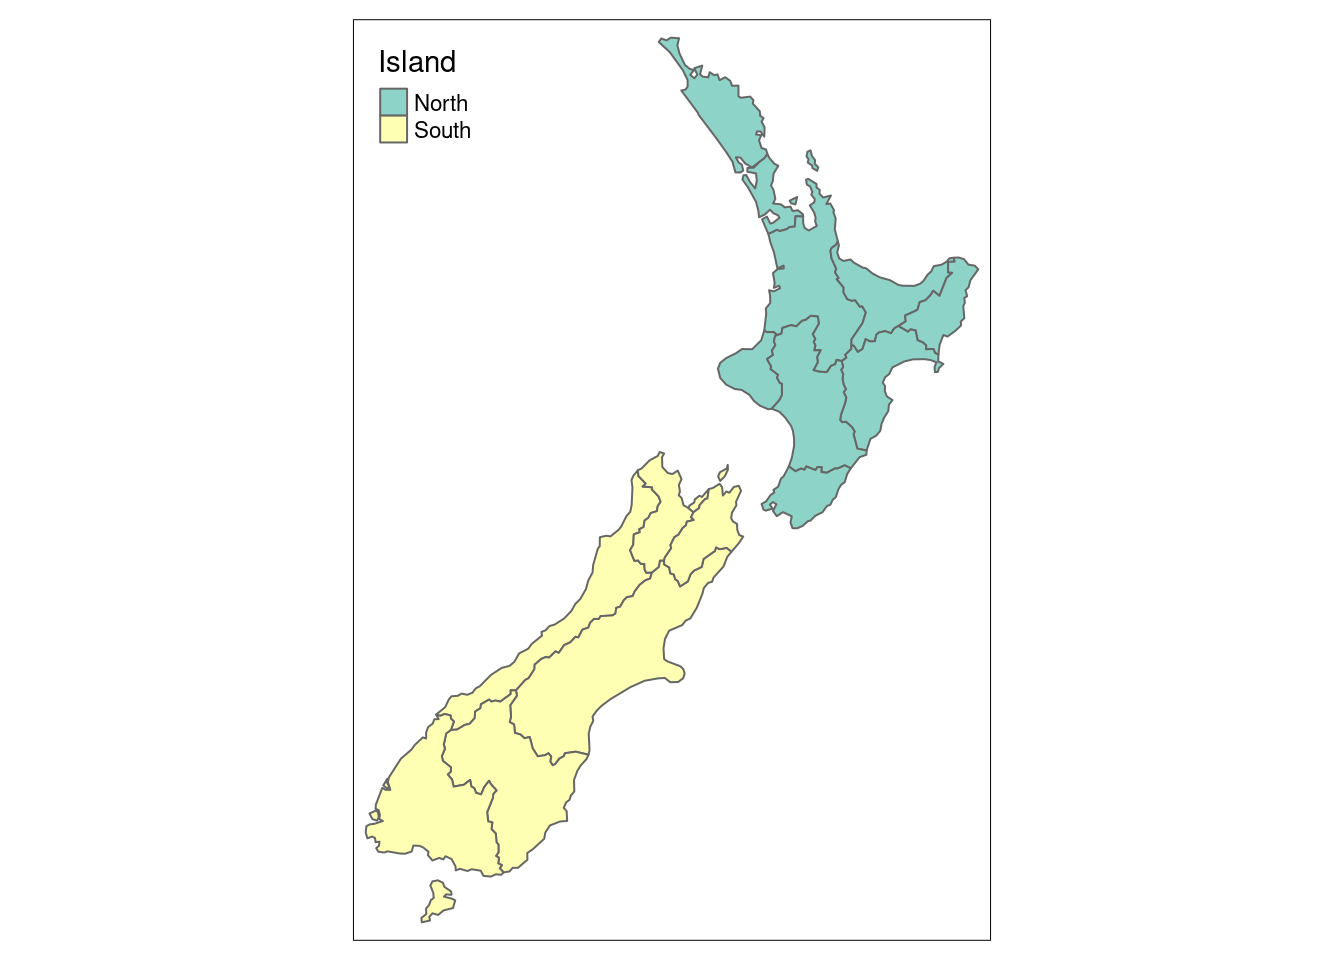
Palettes
# categorical
tm_shape(nz) +
  tm_polygons(col = "Island", style = "cat")
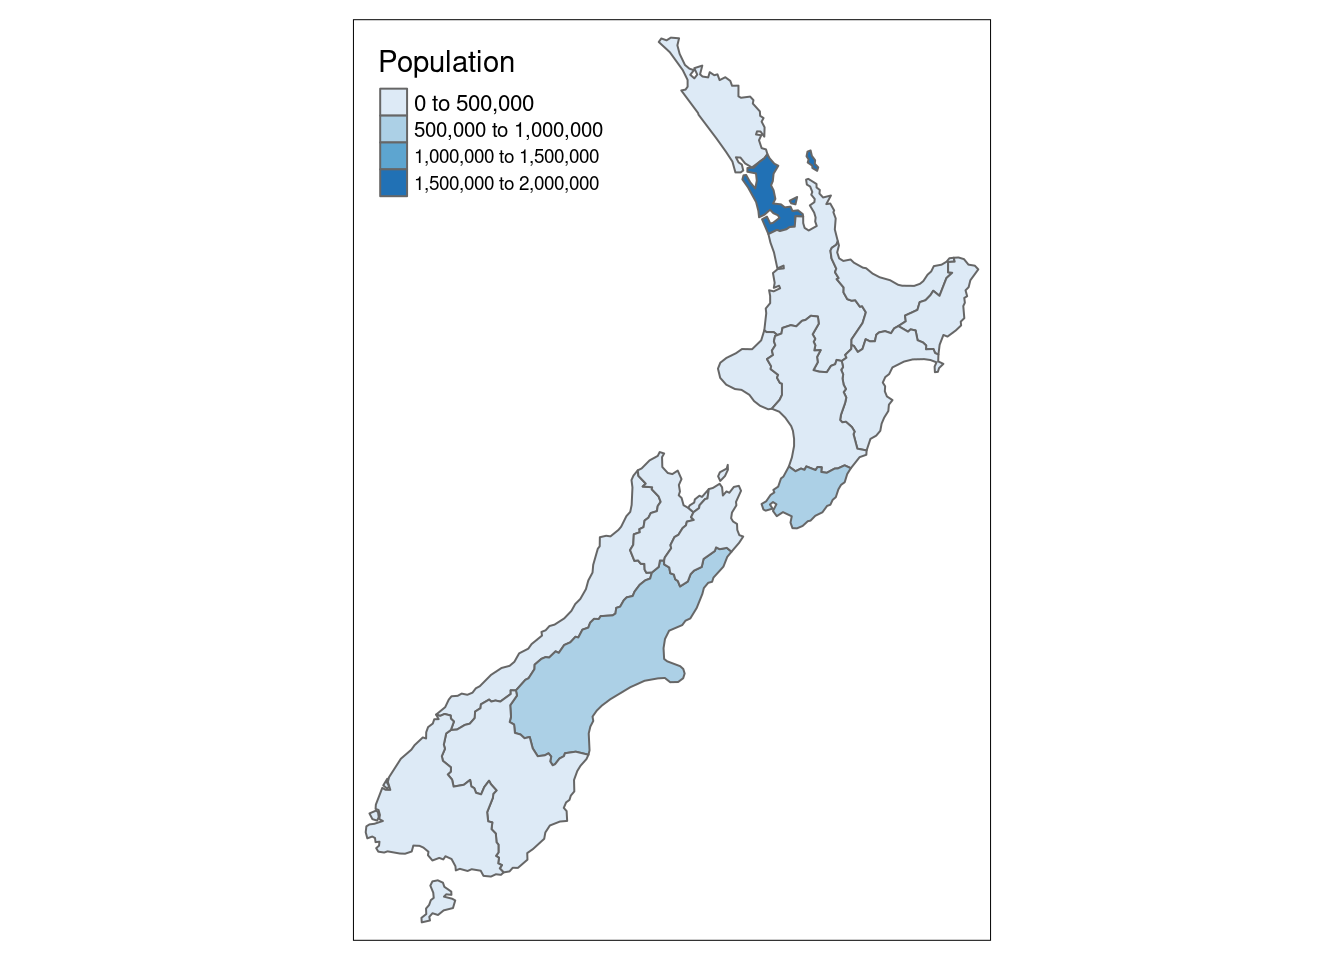
# sequential
tm_shape(nz) + tm_polygons("Population", palette = "Blues")
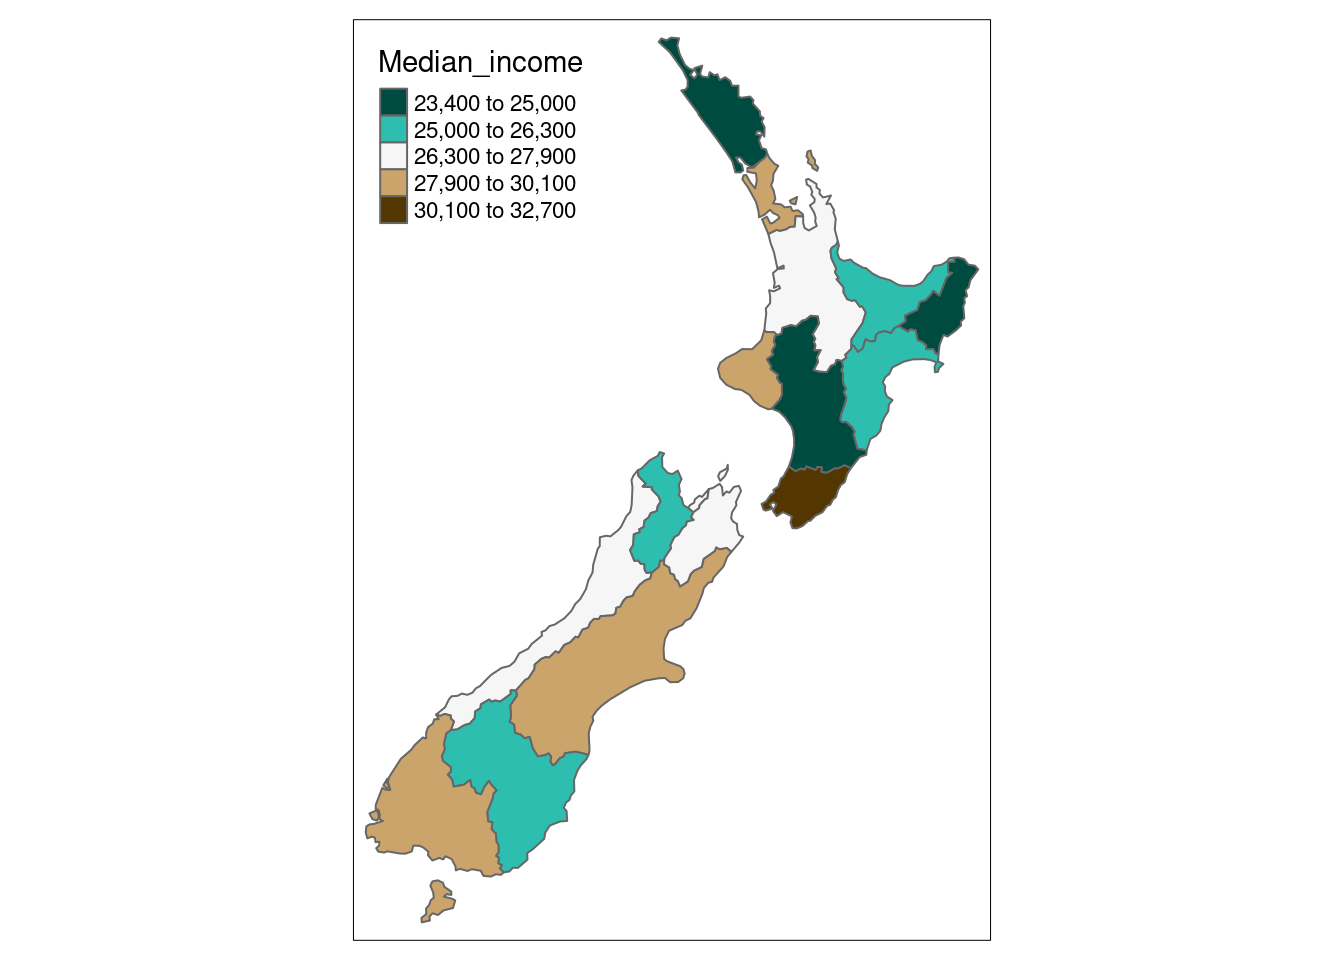
# diverging
tm_shape(nz) +
  tm_polygons(col = "Median_income",
              palette = colorspace::diverging_hcl(5, "Green_Brown"),
              style = "jenks")
# https://colorspace.r-forge.r-project.org/articles/colorspace.html