13.1 Bristol Case Study
How do we increase cycling in the city of Bristol?
An overview of the region’s transport network:
region_all <- rbind(bristol_region, bristol_ttwa)

tm_shape(region_all[1, ], bbox = region_all) +
  tm_fill("yellow", alpha = 0.5) +
  tm_shape(bristol_ways) +
  tm_lines(col = "highway", lwd = 2.1, palette = "-Set1") +
  tm_scale_bar() +
  tm_shape(region_all) +
  tm_borders(col = "black") +
  tm_basemap(server = leaflet::providers$Esri.WorldTopoMap)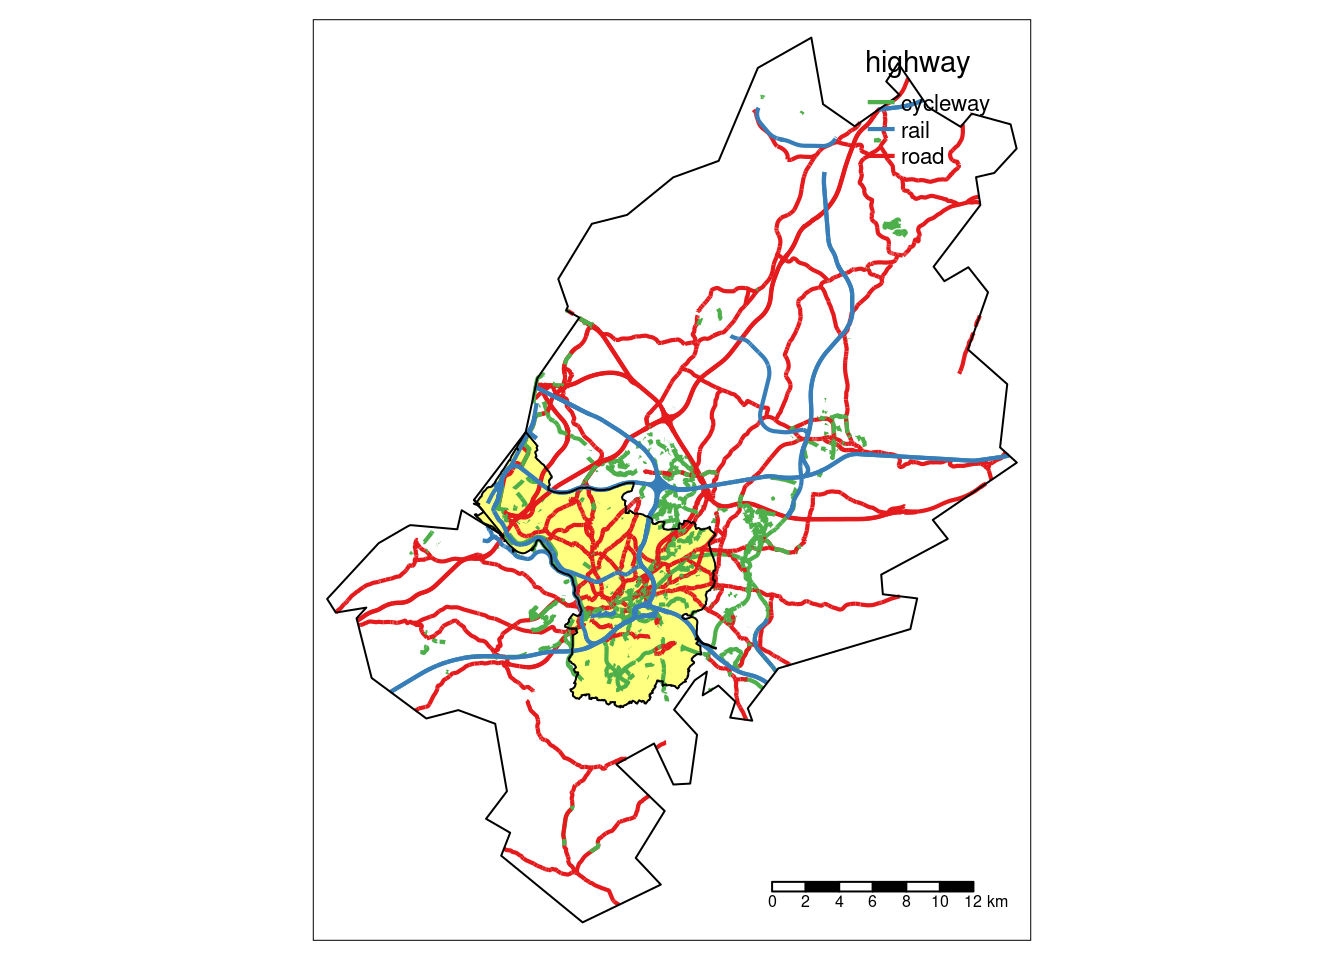
This chapter is guided by the need to provide evidence for stakeholders tasked with getting people out of cars and onto more sustainable modes — walking and cycling in particular.
The simplest way to define a study area is often the first matching boundary returned by OpenStreetMap. For Bristol, a detailed polygon is returned. See the inner blue boundary
But there are a couple of issues with this approach:
- The first OSM boundary returned by OSM may not be the official boundary used by local authorities
- Even if OSM returns the official boundary, this may be inappropriate for transport research because they bear little relation to where people travel
We will talk about the much larger Travel To Work Area in the next section.