Geometry Unions
# us_states was the shapefile of the continental US states

# combining demographic information by regions
us_regions = us_states |>
  group_by(REGION) |>
  summarize(pop = sum(total_pop_15, na.rm = TRUE))
## although coordinates are longitude/latitude, st_union assumes that they are
## planar
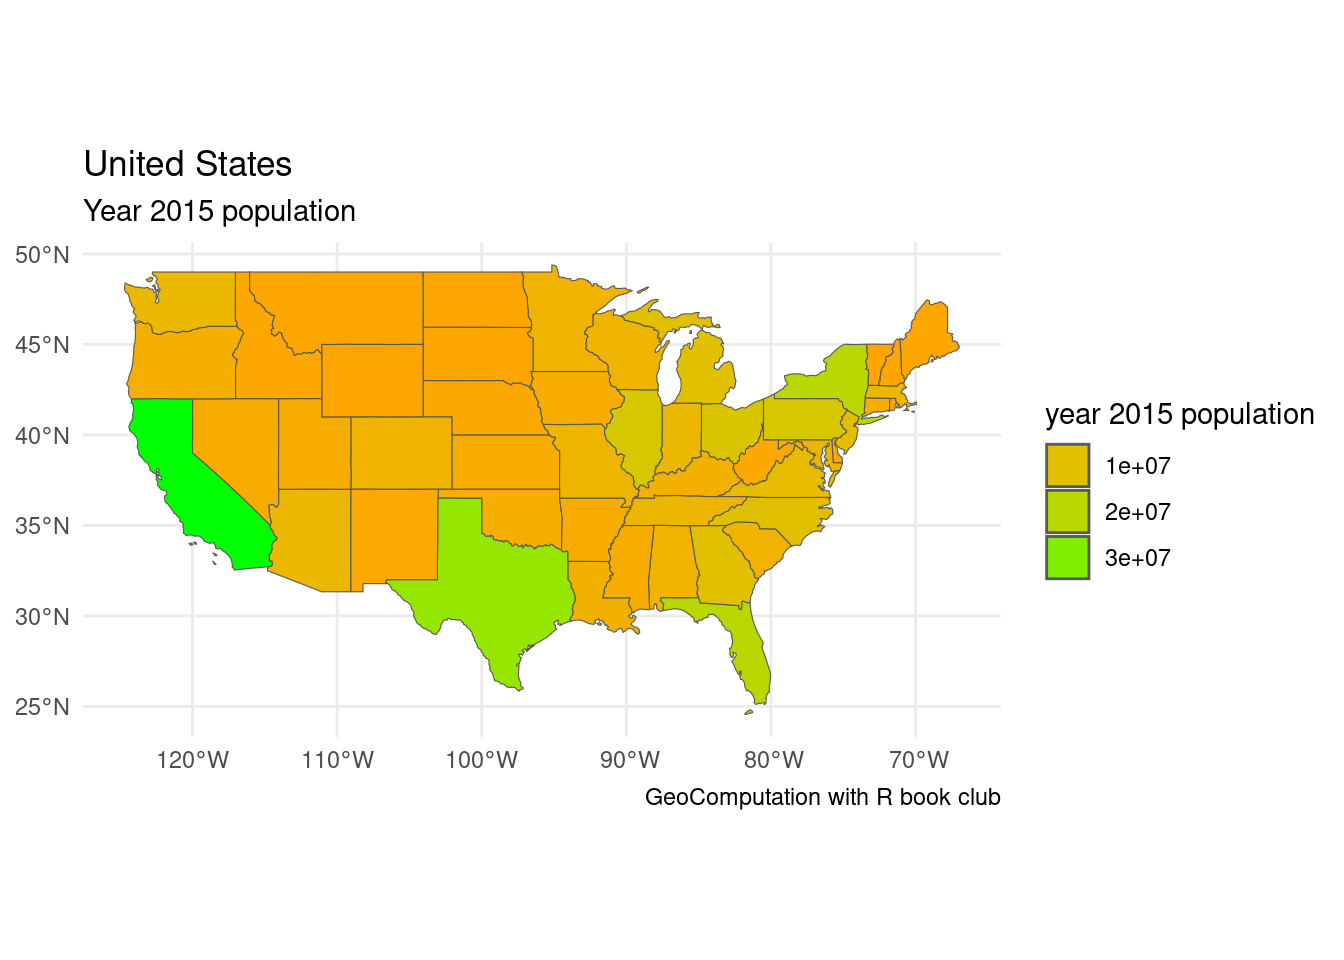
us_states |>
  ggplot() +
  geom_sf(aes(fill = total_pop_15)) +
  guides(fill=guide_legend(title="year 2015 population")) +
  labs(title = "United States",
       subtitle = "Year 2015 population",
       caption = "GeoComputation with R book club") +
  scale_fill_gradient(low = "orange", high = "green") +
  theme_minimal()
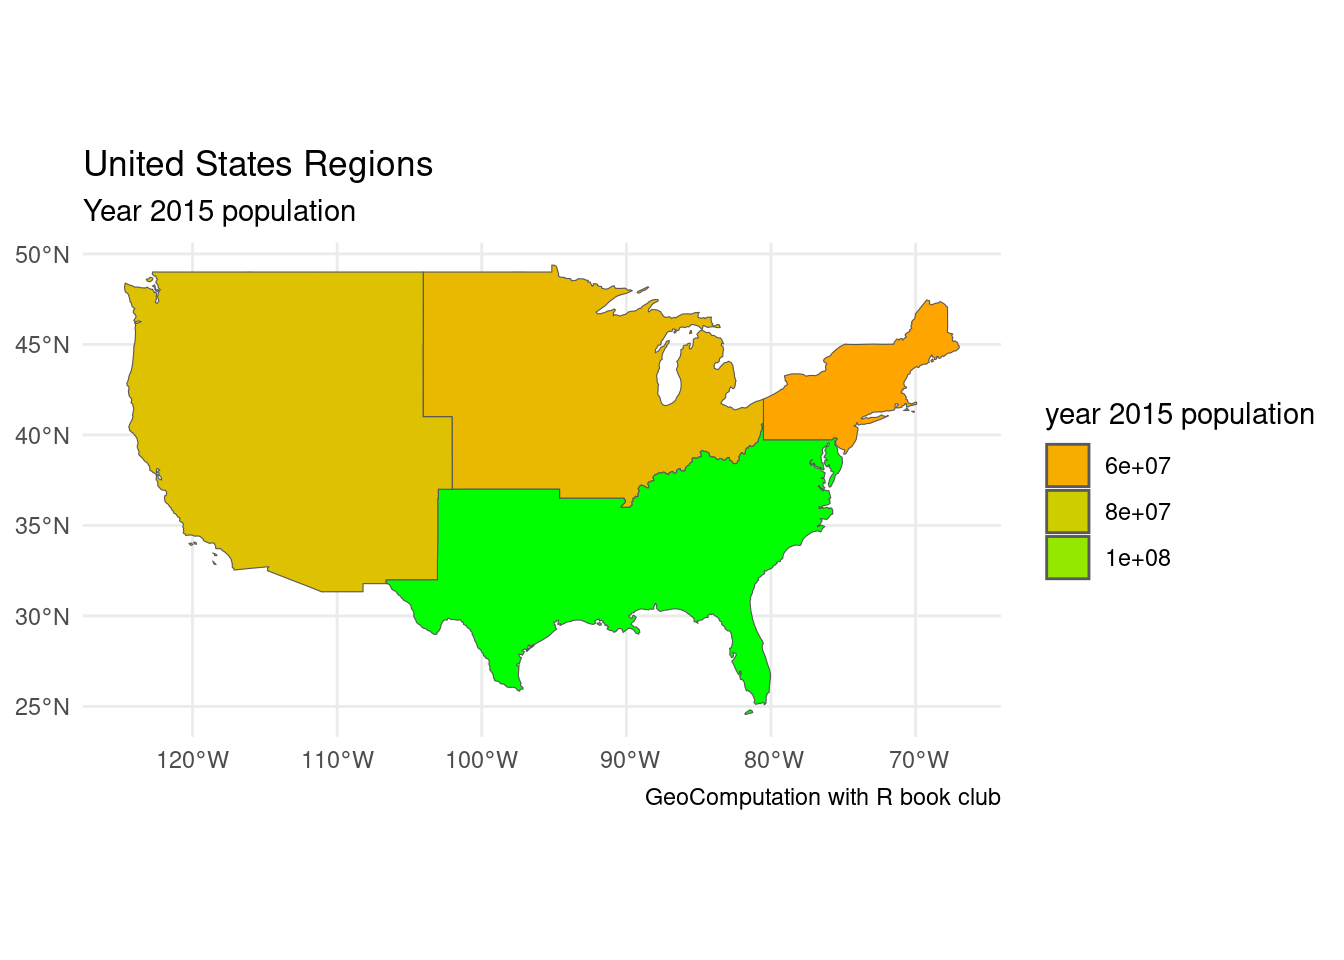
us_regions |>
  ggplot() +
  geom_sf(aes(fill = pop)) +
  guides(fill=guide_legend(title="year 2015 population")) +
  labs(title = "United States Regions",
       subtitle = "Year 2015 population",
       caption = "GeoComputation with R book club") +
  scale_fill_gradient(low = "orange", high = "green") +
  theme_minimal()