21.2 Tidy method from the {broom} package
- predictable outcome for many different models and statistical tests
- always a tibble
- consistent column names
- most useful for analysing / visualizing multiple models/tests
- easier to combine results (no rownames)
- also used internally by higher level functions in tidymodels packages
- other packages also provide tidy methods for their own data structures
- different models, tests will have different structures based on what makes sense, but use as similar structure as possible
You can get the same outcome from many different input formats.
race_top_results %>%
  ggplot(aes(avg_elevation_gain, avg_velocity)) +
  geom_point(alpha = 0.3) +
  geom_smooth(method = "lm") +
  expand_limits(y = 0)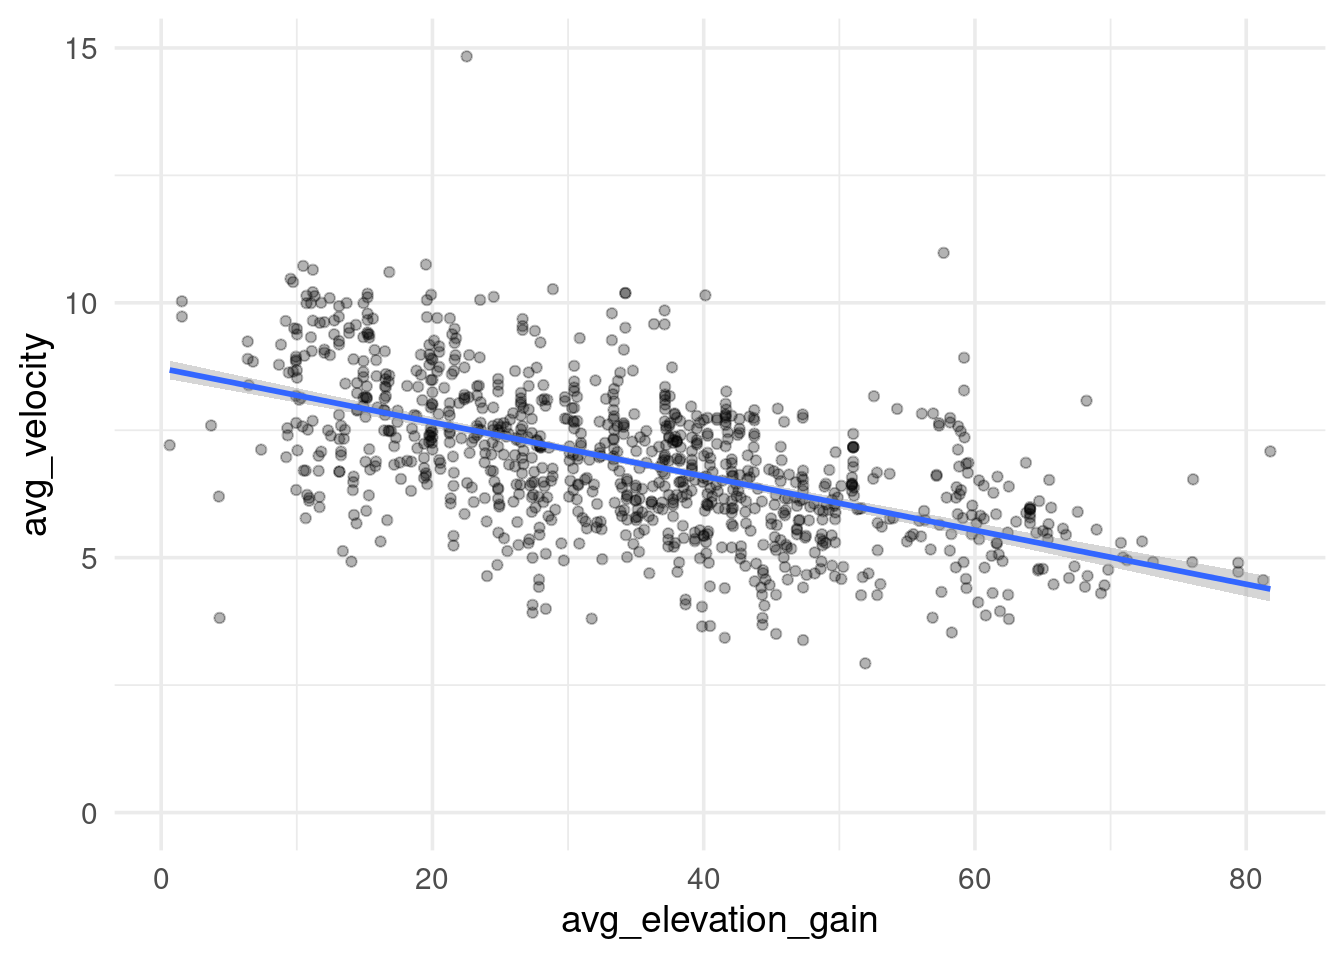
As makes sense intuitively, higher elevation gain per mile results in lower velocity.
lm_spec <- linear_reg() %>% set_engine("lm")

wf <- workflow() %>%
  add_model(lm_spec) %>%
  add_formula(avg_velocity ~ avg_elevation_gain + distance)

fitted_wf <- wf %>%
  fit(race_top_results)

fitted_wf %>% tidy()
## # A tibble: 3 × 5
## term estimate std.error statistic p.value
## <chr> <dbl> <dbl> <dbl> <dbl>
## 1 (Intercept) 12.7 0.760 16.7 2.95e-55
## 2 avg_elevation_gain -0.0518 0.00248 -20.9 2.34e-80
## 3 distance -0.0247 0.00469 -5.27 1.64e- 7lm_spec %>%
fit(avg_velocity ~ avg_elevation_gain + distance, data = race_top_results) %>%
tidy()## # A tibble: 3 × 5
## term estimate std.error statistic p.value
## <chr> <dbl> <dbl> <dbl> <dbl>
## 1 (Intercept) 12.7 0.760 16.7 2.95e-55
## 2 avg_elevation_gain -0.0518 0.00248 -20.9 2.34e-80
## 3 distance -0.0247 0.00469 -5.27 1.64e- 7{broom} existed before {tidymodels}, it works for base R lm model object as well.
fitted_wf %>% extract_fit_engine() %>% tidy()## # A tibble: 3 × 5
## term estimate std.error statistic p.value
## <chr> <dbl> <dbl> <dbl> <dbl>
## 1 (Intercept) 12.7 0.760 16.7 2.95e-55
## 2 avg_elevation_gain -0.0518 0.00248 -20.9 2.34e-80
## 3 distance -0.0247 0.00469 -5.27 1.64e- 7lm(avg_velocity ~ avg_elevation_gain + distance, data = race_top_results) %>%
tidy()## # A tibble: 3 × 5
## term estimate std.error statistic p.value
## <chr> <dbl> <dbl> <dbl> <dbl>
## 1 (Intercept) 12.7 0.760 16.7 2.95e-55
## 2 avg_elevation_gain -0.0518 0.00248 -20.9 2.34e-80
## 3 distance -0.0247 0.00469 -5.27 1.64e- 7In addition to models, we can tidy the result of tests such as correlation test or t-test.
cor.test(race_top_results$avg_velocity, race_top_results$avg_elevation_gain) %>%
  tidy()
## # A tibble: 1 × 8
## estimate statistic p.value parameter conf.low conf.high method alternative
## <dbl> <dbl> <dbl> <int> <dbl> <dbl> <chr> <chr>
## 1 -0.561 -21.2 4.01e-82 974 -0.603 -0.517 Pearson'… two.sidedt.test(
race_top_results %>% filter(date > '2015-01-01') %>% pull(avg_velocity),
race_top_results %>% filter(date <= '2015-01-01') %>% pull(avg_velocity)
) %>%
tidy()## # A tibble: 1 × 10
## estimate estimate1 estimate2 statistic p.value parameter conf.low conf.high
## <dbl> <dbl> <dbl> <dbl> <dbl> <dbl> <dbl> <dbl>
## 1 -0.417 6.78 7.20 -4.19 0.0000335 489. -0.613 -0.221
## # ℹ 2 more variables: method <chr>, alternative <chr>