15.3 Ranking models
Let’s look at our results
# How many models are there?
n_model <-
  res_grid %>%
  collect_metrics(summarize = FALSE) %>%
  nrow()
n_model
## [1] 3000res_grid_filt <-
res_grid %>%
# 'cart_bag' has <rsmp[+]> in the `results` column, so it won't work with `rank_results()`
filter(wflow_id != 'cart_bag')
# Note that xgboost sucks if you don't have good parameters
res_ranks <-
res_grid_filt %>%
workflowsets::rank_results('rmse') %>%
# Why this no filter out rsquared already?
filter(.metric == 'rmse') %>%
select(wflow_id, model, .config, rmse = mean, rank) %>%
group_by(wflow_id) %>%
slice_min(rank, with_ties = FALSE) %>%
ungroup() %>%
arrange(rank)
res_ranks## # A tibble: 11 × 5
## wflow_id model .config rmse rank
## <chr> <chr> <chr> <dbl> <int>
## 1 norm_svm_p svm_poly Preprocessor1_Model2 0.513 1
## 2 formula_rf rand_forest Preprocessor1_Model2 0.546 3
## 3 formula_cart_bag bag_tree Preprocessor1_Model1 0.559 5
## 4 formula_cube cubist_rules Preprocessor1_Model2 0.567 7
## 5 formula_mars mars Preprocessor1_Model2 0.570 9
## 6 formula_gb boost_tree Preprocessor1_Model2 0.580 11
## 7 norm_knn nearest_neighbor Preprocessor1_Model2 0.587 12
## 8 poly_knn nearest_neighbor Preprocessor1_Model3 0.674 17
## 9 formula_cart decision_tree Preprocessor1_Model3 0.689 18
## 10 poly_lr linear_reg Preprocessor1_Model2 0.768 23
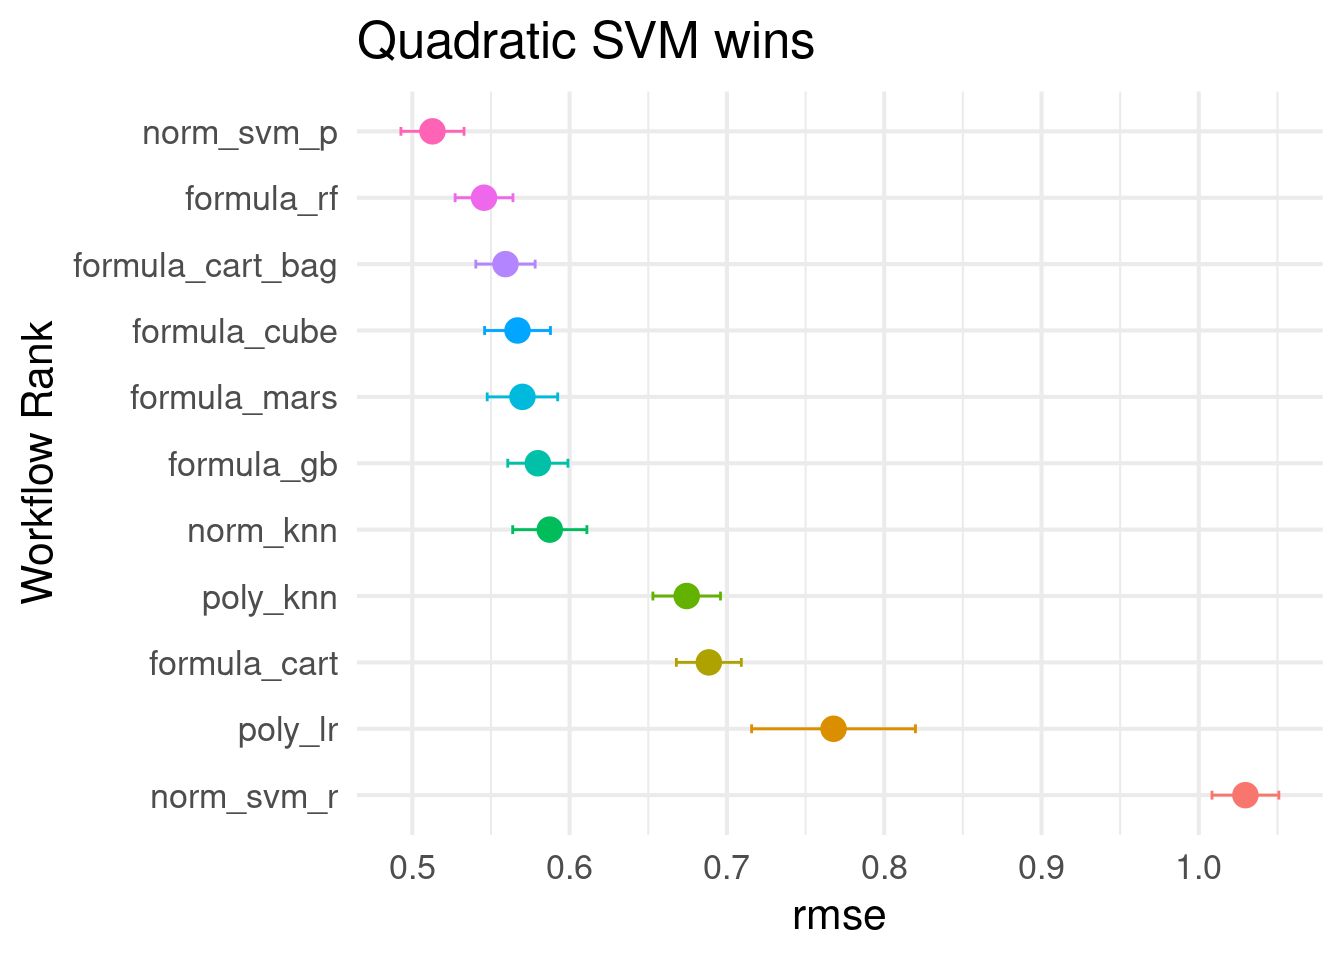
## 11 norm_svm_r svm_rbf Preprocessor1_Model3 1.03 24Plot the ranks with standard errors.

If we wanted to look at the sub-models for a given wflow_id, we could do that with autoplot().
autoplot(
  res_grid,
  id = 'norm_svm_p',
  metric = 'rmse'
)
How I feel every time I use autoplot()
autoplot()
As shown in the book chapter, this could be a really good use case for finetune::control_race() and workflowsets::workflow_map('tune_race_anova', ...)