18.3 Local Explanations
Provides information about a prediction for a single observation
Which variables contribute to this result the most?
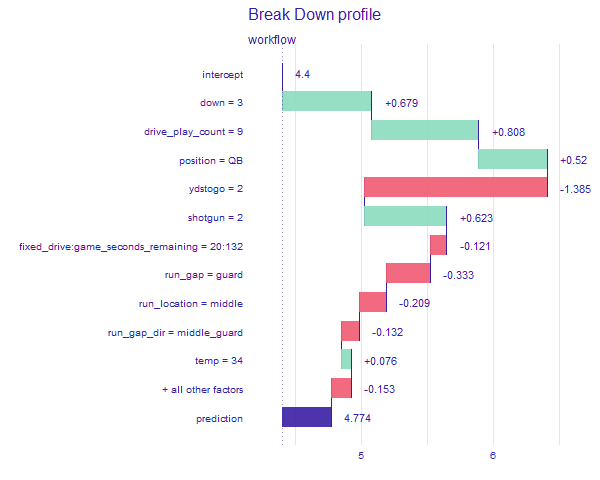
“Break-down” explanations compute the contribution from each feature
- Results for many explanatory variables can be presented in a limited space
- Only the additive attributions, misleading for models with interactions

- Break-down plots with interactions
- More accurate if the model itself uses interactions
- Much more time-consuming
- Interactions is not based on any formal statistical-significance test
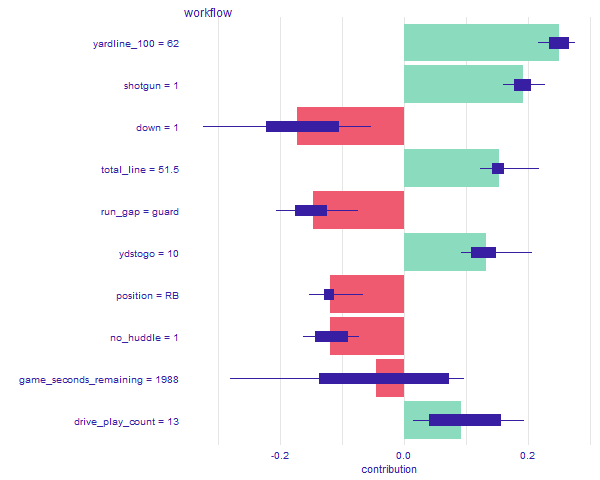
- SHapley Additive exPlanations (SHAP) are based on “Shapley values”
- “Cooperation is beneficial, because it may bring more benefit than individual actions”
- Decompose a model’s predictions into contributions that can be attributed additively to different explanatory variables
- If the model is not additive, then the Shapley values may be misleading
#Break-down
boost_breakdown <- predict_parts(explainer = explainer_boost,
                                 new_observation = sample_n(rush_df,1))

png(file="images/18_boost_breakdown.png", width = 600)
plot(boost_breakdown)
dev.off()


#Break-dwon Interactions
boost_breakdown2 <- predict_parts(explainer = explainer_boost,
                                 new_observation = sample_n(rush_df,1),
                                 type = "break_down_interactions")

png(file="images/18_boost_breakdown2.png", width = 600)
plot(boost_breakdown2)
dev.off()

#SHAP
boost_breakdown3 <- predict_parts(explainer = explainer_boost,
                                 new_observation = sample_n(rush_df,1),
                                 type = "shap")

png(file="images/18_boost_breakdown3.png", width = 600)
plot(boost_breakdown3)
dev.off()