18.6 Global Explanations from Local Explanations
- Partial-dependence plots
- How does the expected value of model prediction behave as a function of a selected explanatory variable?
- PD profiles are averages of CP profiles
- Problematic for correlated explanatory variables
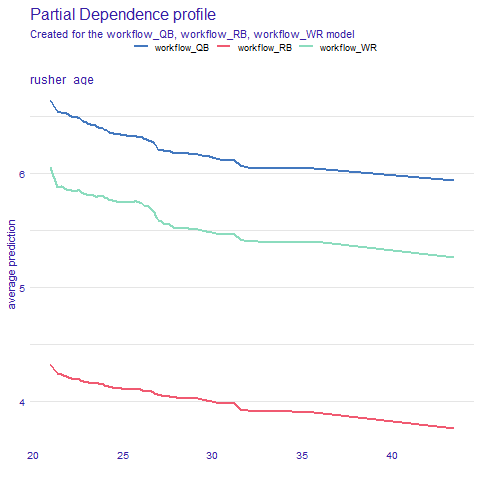
boost_profile <- model_profile(explainer_boost,
                               N = 1000,
                               variables = "rusher_age",
                               groups = "position")

png(file="images/18_boost_profile.png")
plot(boost_profile)
dev.off()