18.4 Local Explanations for Interactions
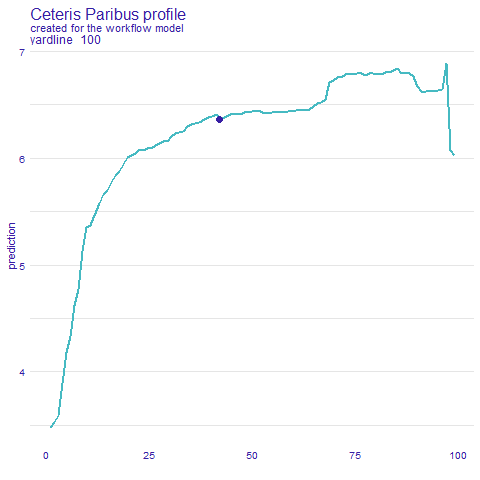
“Ceteris-paribus” profiles show how a model’s prediction would change if the value of a single exploratory variable changed
- Graphical representation is easy to understand and explain
- Not a valid assumption with highly correlated or interaction variables

#Ceterus Paribus
boost_paribus <- predict_profile(explainer = explainer_boost,
                                 new_observation = sample_n(rush_df,1),
                                 variables = c("rusher_age", "yardline_100"))

png(file="images/18_boost_paribus.png")
plot(boost_paribus, variables = c("rusher_age"))
dev.off()

png(file="images/18_boost_paribus2.png")
plot(boost_paribus, variables = c("yardline_100"))
dev.off()