16.3 Introducing the beans dataset
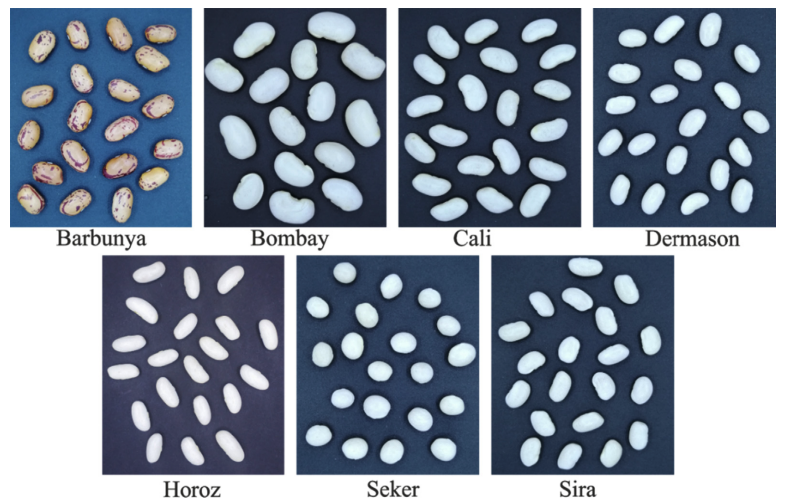
Dry bean images (Koklu and Ozkan 2020)
- Predict bean types from images
- Features have already been calculated from images of bean samples:
area,perimeter,eccentricity,roundness, etc - How do these features relate to each other?
library(tidymodels)
tidymodels_prefer()
library(beans)
library(corrr)

beans_corr <- beans %>%
  select(-class) %>%      # drop non-numeric cols
  correlate() %>%         # generate a correlation matrix in data frame format
  rearrange() %>%         # group highly correlated variables together
  shave()                 # shave off the upper triangle

# plot the correlation matrix
beans_corr %>%
  rplot(print_cor=TRUE) +
  theme(axis.text.x = element_text(angle = 90, hjust = 1))
We can see that many features are highly correlated.