Tuning Process
There are two important tuning parameters associated with our MARS model:
degree: the maximum degree of interactions, where rarely is there any benefit in assessing greater than 3-rd degree interactions.nprune: Maximum number of terms (including intercept) in the pruned model, where you can start out with 10 evenly spaced values.
# create a tuning grid
hyper_grid <- expand.grid(
  degree = 1:3,
  nprune = seq(2, 100, length.out = 10) |> floor()
)

head(hyper_grid)
## degree nprune
## 1 1 2
## 2 2 2
## 3 3 2
## 4 1 12
## 5 2 12
## 6 3 127.0.3 Caret
# Cross-validated model
set.seed(123)  # for reproducibility
cv_mars <- train(
  x = subset(ames_train, select = -Sale_Price),
  y = ames_train$Sale_Price,
  method = "earth",
  metric = "RMSE",
  trControl = trainControl(method = "cv", number = 10),
  tuneGrid = hyper_grid
)


# View results
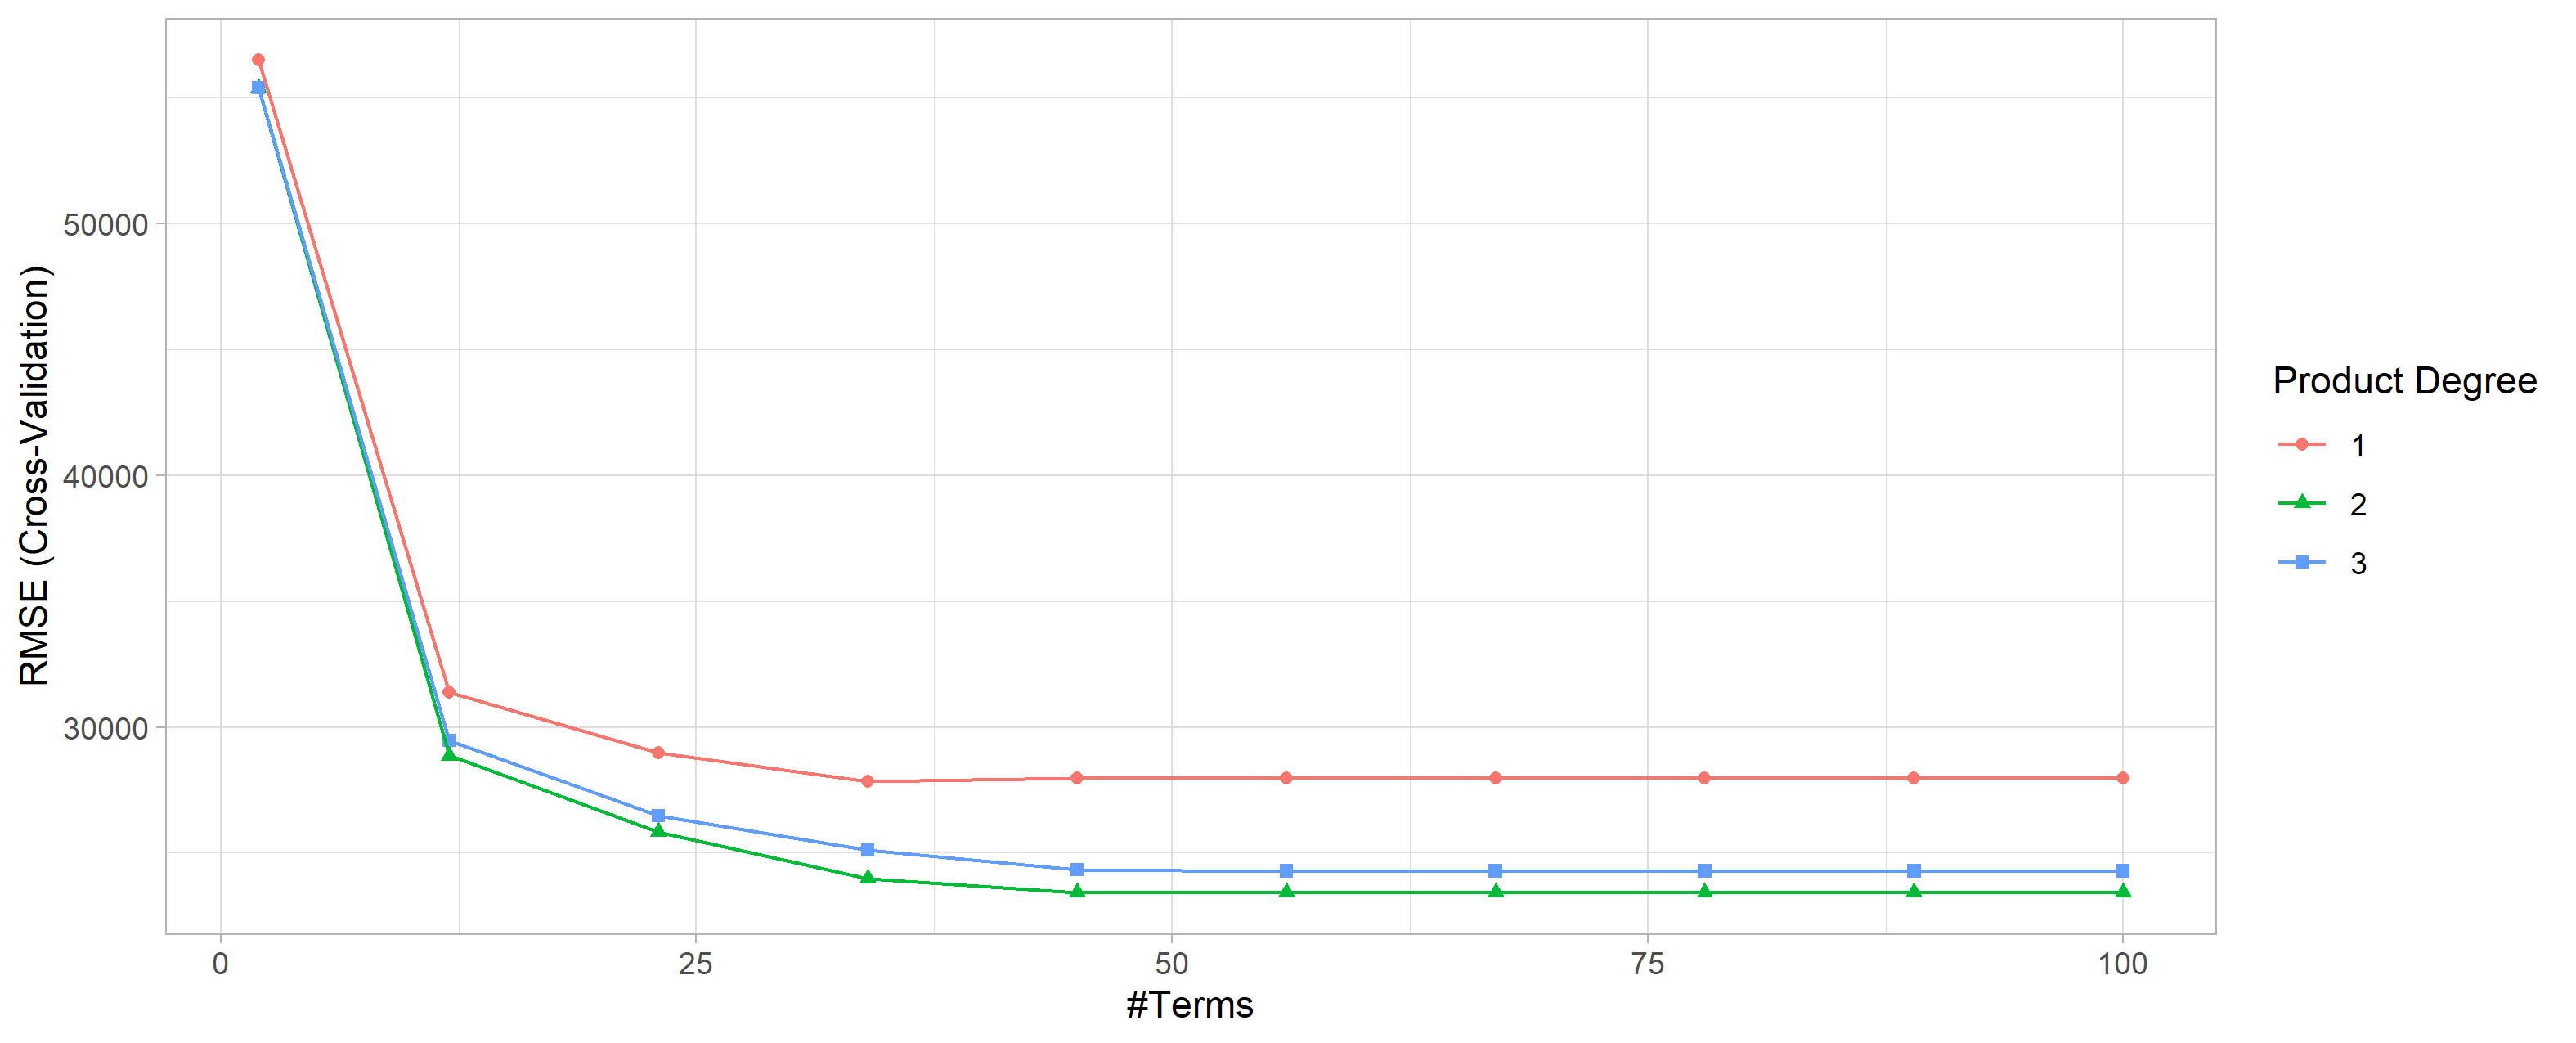
cv_mars$bestTune
##    nprune degree
## 16     45      2


cv_mars$results |>
  filter(nprune == cv_mars$bestTune$nprune,
         degree == cv_mars$bestTune$degree)
#   degree nprune     RMSE  Rsquared     MAE RMSESD RsquaredSD    MAESD
# 1 2 45 23427.47 0.9156561 15767.9 1883.2 0.01365285 794.2688ggplot(cv_mars)+
theme_light()
cv_mars$resample$RMSE |> summary()
#  Min. 1st Qu.  Median    Mean 3rd Qu.    Max.
# 20735   22053   23189   23427   24994   26067


cv_mars$resample
#        RMSE  Rsquared      MAE Resample
# 1  23243.22 0.9387415 15777.98   Fold04
# 2  23044.17 0.9189506 15277.56   Fold03
# 3  23499.99 0.9205506 16190.29   Fold07
# 4  23135.62 0.9226565 16106.93   Fold01
# 5  25491.41 0.8988816 16255.55   Fold05
# 6  21414.96 0.9202359 15987.68   Fold08
# 7  21722.58 0.9050642 14694.66   Fold02
# 8  26066.88 0.8938272 16635.14   Fold06
# 9  20735.28 0.9274782 14226.06   Fold10
# 10 25920.58 0.9101751 16527.20   Fold09
7.0.4 Tidymodels
The main benefit of using tidymodels to perform 10-CV is that you can stratify the folds, which can be very useful taking in consideration that the target variable is right-skewed.
ggplot(ames_train, aes(Sale_Price))+
  geom_histogram(fill = "blue", alpha = 0.6)+
  theme_light()
- Define the model to train
mars_model <-
  mars() |>
  set_mode("regression") |>
  set_engine("earth") |>
  set_args(nprune = tune(),
degree = tune())- Define the recipe to use
mars_recipe <-
  recipe(Sale_Price ~ ., data = ames_train) |>
  step_dummy(all_nominal_predictors()) |>
prep(training = ames_train) - Create a
workflowobject to join the model and recipe.
mars_wf <-
  workflows::workflow() |>
  workflows::add_recipe(mars_recipe) |>
workflows::add_model(mars_model)- Create the folds with
rsample
set.seed(123)

ames_folds <-
  vfold_cv(ames_train,
           v = 10,
strata = Sale_Price)- Getting metrics for each resample
mars_rs_fit <-
  mars_wf |>
  tune::tune_grid(resamples = ames_folds,
                  grid = hyper_grid,
metrics = yardstick::metric_set(yardstick::rmse))- Check the winner’s parameters
mars_rs_fit |>
  tune::show_best(metric = 'rmse', n = 3)

#   nprune degree .metric .estimator   mean     n std_err .config
#    <dbl>  <int> <chr>   <chr>       <dbl> <int>   <dbl> <chr>
# 1      2      1 rmse    standard   25808.    10   1378. Preprocessor1_Model01
# 2      2      2 rmse    standard   25808.    10   1378. Preprocessor1_Model02
# 3      2      3 rmse    standard   25808.    10   1378. Preprocessor1_Model03


final_mars_wf <-
  mars_rs_fit |>
  tune::select_best(metric = 'rmse') |>
  tune::finalize_workflow(x = mars_wf)

# ══ Workflow ════════════════════════════════
# Preprocessor: Recipe
# Model: mars()
#
# ── Preprocessor ────────────────────────────
# 1 Recipe Step
#
# • step_dummy()
#
# ── Model ───────────────────────────────────
# MARS Model Specification (regression)
#
# Engine-Specific Arguments:
#   nprune = 2
#   degree = 1
#
# Computational engine: earth