6.6 - Attrition data
We saw that regularization significantly improved our predictive accuracy for the Ames data set, but how about for the employee attrition example from Chapter 5?
attrition <- modeldata::attrition

df <- attrition %>% mutate_if(is.ordered, factor, ordered = FALSE)

# Create training (70%) and test (30%) sets for the
# rsample::attrition data. Use set.seed for reproducibility
set.seed(123)
churn_split <- initial_split(df, prop = .7, strata = "Attrition")
train <- training(churn_split)
test  <- testing(churn_split)

# train logistic regression model (no regularization)
set.seed(123)
glm_mod <- train(
  Attrition ~ .,
  data = train,
  method = "glm",
  family = "binomial",
  preProc = c("zv", "center", "scale"),
  trControl = trainControl(method = "cv", number = 10)
  )

# evaluation metrics
glm_mod$results
## parameter Accuracy Kappa AccuracySD KappaSD
## 1 none 0.8715662 0.4539185 0.03610858 0.1452058# number of coefficients
length(glm_mod$coefnames)## [1] 57# train regularized logistic regression model
set.seed(123)
penalized_mod <- train(
Attrition ~ .,
data = train,
method = "glmnet",
family = "binomial",
preProc = c("zv", "center", "scale"),
trControl = trainControl(method = "cv", number = 10),
tuneLength = 10
)
# evaluation metrics
penalized_mod$resample$Accuracy## [1] 0.8349515 0.8653846 0.8823529 0.8349515 0.9223301 0.8823529 0.8834951
## [8] 0.8725490 0.9126214 0.9029126penalized_mod$resample$Kappa## [1] 0.2343682 0.2639029 0.4035088 0.1912240 0.6281588 0.4035088 0.4467323
## [8] 0.4137931 0.5974815 0.5657673# number of coefficients
length(penalized_mod$coefnames)## [1] 57# extract out of sample performance measures
accuracy_list <- summary(resamples(list(
logistic_model = glm_mod,
penalized_model = penalized_mod
)))$statistics$Accuracy
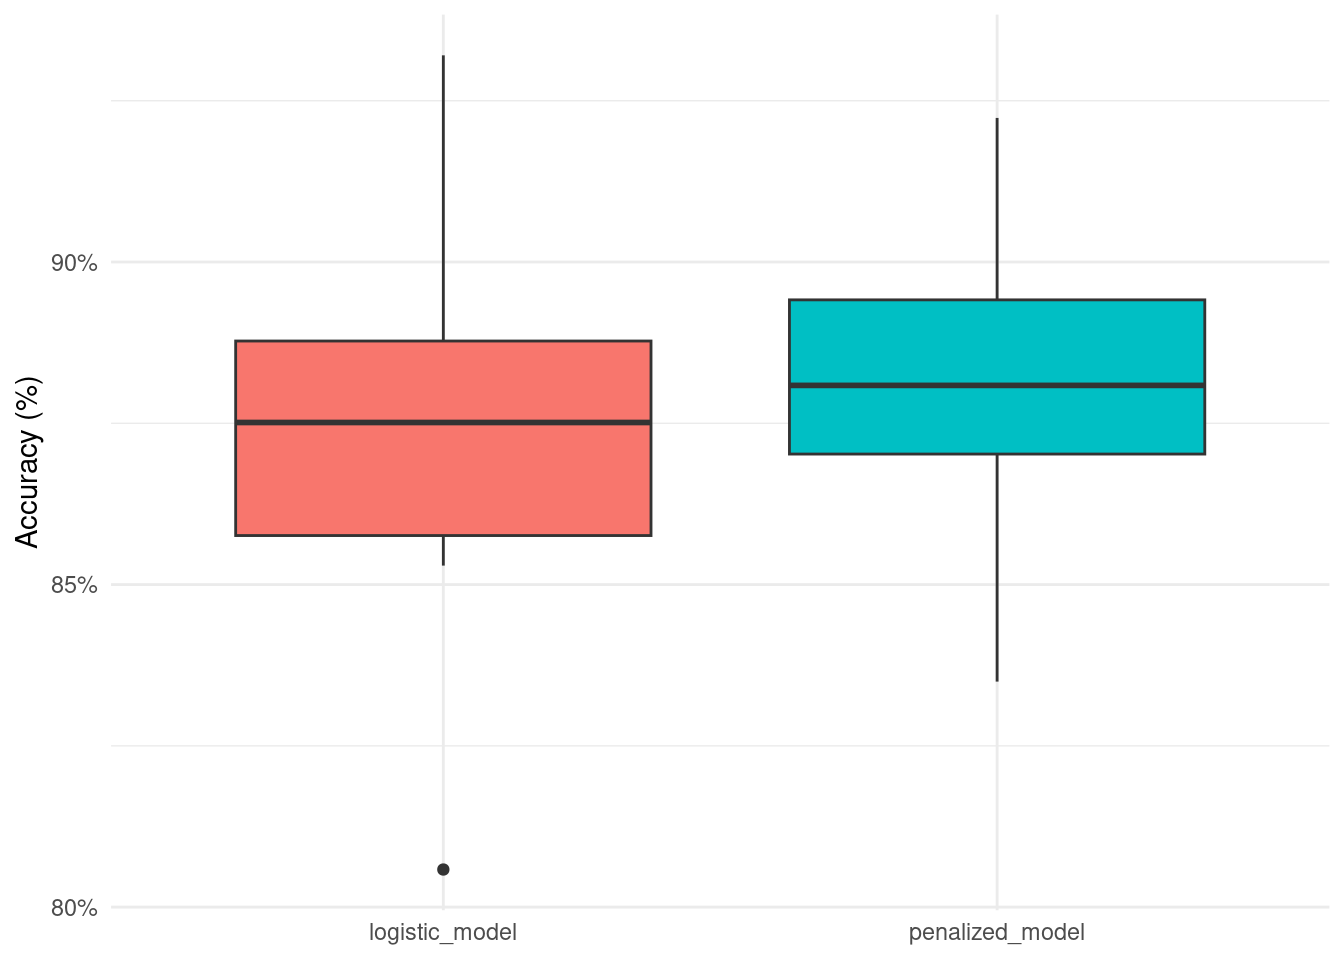
accuracy_list## Min. 1st Qu. Median Mean 3rd Qu. Max.
## logistic_model 0.8058252 0.8529412 0.8786765 0.8715662 0.8907767 0.9320388
## penalized_model 0.8349515 0.8671757 0.8823529 0.8793902 0.8980583 0.9223301
## NA's
## logistic_model 0
## penalized_model 0# accuracy boxplot
accuracy_df <- as.data.frame(accuracy_list)
accuracy_df %>%
select(-7) %>%
rownames_to_column() %>%
rename(.model = rowname) %>%
pivot_longer(-.model) %>%
ggplot(aes(.model, value, fill = .model)) +
geom_boxplot(show.legend = FALSE) +
scale_y_continuous(labels = scales::percent) +
labs(x = NULL,
y = 'Accuracy (%)')
# t-test
accuracy_long_df <- accuracy_df %>%
     select(-7) %>%
     # rownames_to_column() %>%
     # rename(.model = rowname) %>%
     t() %>%
     as.data.frame()

rownames(accuracy_long_df) <- 1:nrow(accuracy_long_df)

t.test(accuracy_long_df$logistic_model, accuracy_long_df$penalized_model)
##
## Welch Two Sample t-test
##
## data: accuracy_long_df$logistic_model and accuracy_long_df$penalized_model
## t = -0.41886, df = 8.9681, p-value = 0.6852
## alternative hypothesis: true difference in means is not equal to 0
## 95 percent confidence interval:
## -0.05596183 0.03848384
## sample estimates:
## mean of x mean of y
## 0.8719708 0.8807098# kappa
kappa_list <- summary(resamples(list(
logistic_model = glm_mod,
penalized_model = penalized_mod
)))$statistics$Kappa
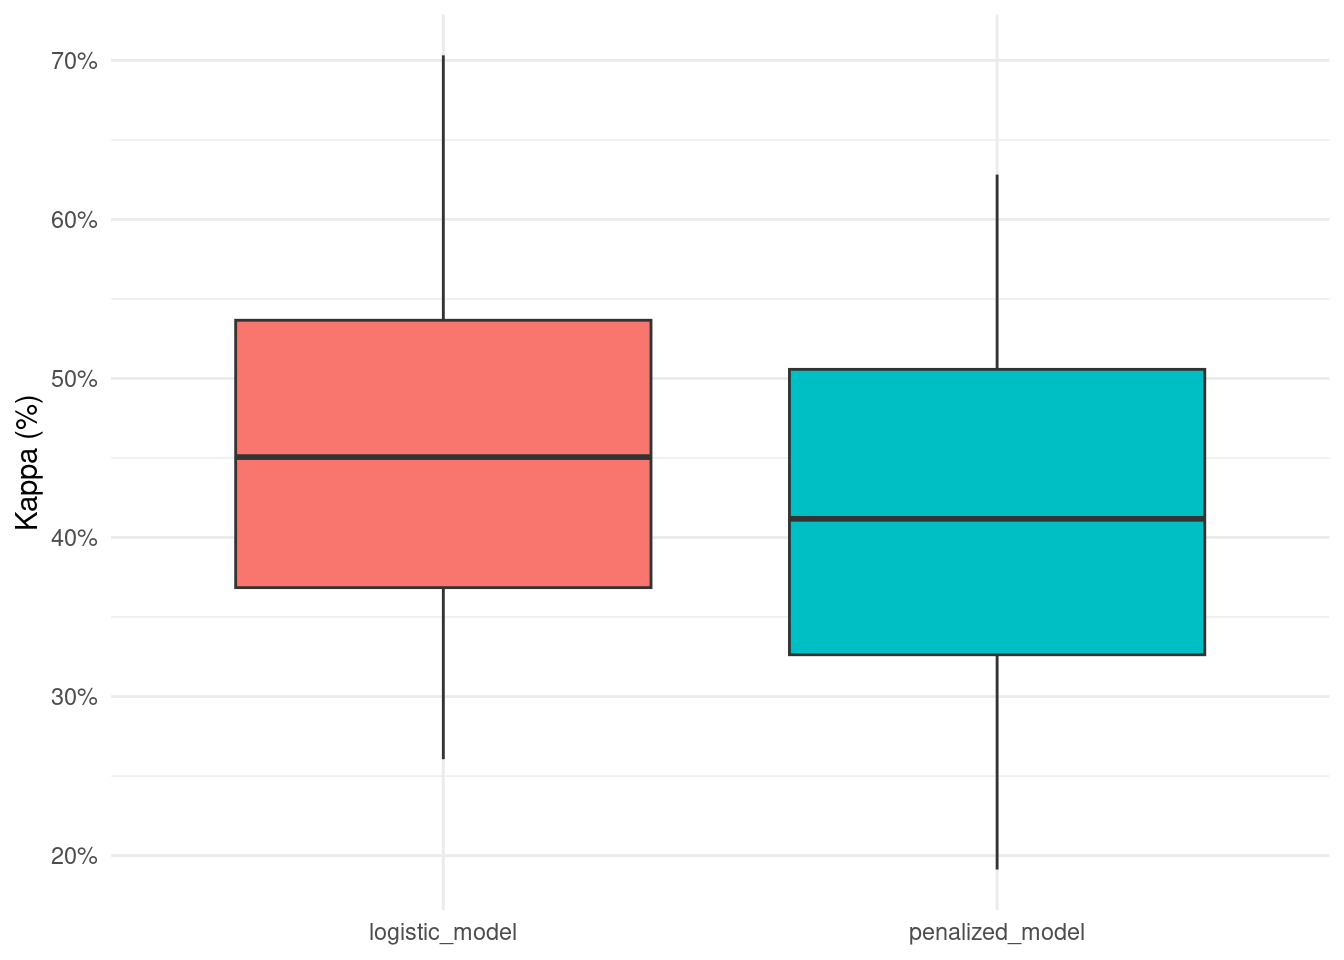
kappa_list## Min. 1st Qu. Median Mean 3rd Qu. Max.
## logistic_model 0.2605887 0.3422335 0.4471863 0.4539185 0.5641394 0.7031700
## penalized_model 0.1912240 0.2988044 0.4086509 0.4148446 0.5360085 0.6281588
## NA's
## logistic_model 0
## penalized_model 0# kappa boxplot
kappa_df <- as.data.frame(kappa_list)
kappa_df %>%
select(-7) %>%
rownames_to_column() %>%
rename(.model = rowname) %>%
pivot_longer(-.model) %>%
ggplot(aes(.model, value, fill = .model)) +
geom_boxplot(show.legend = FALSE) +
scale_y_continuous(labels = scales::percent) +
labs(x = NULL,
y = 'Kappa (%)')
# t-test
kappa_long_df <- kappa_df %>%
     select(-7) %>%
     # rownames_to_column() %>%
     # rename(.model = rowname) %>%
     t() %>%
     as.data.frame()

rownames(kappa_long_df) <- 1:nrow(kappa_long_df)

t.test(kappa_long_df$logistic_model, kappa_long_df$penalized_model)
##
## Welch Two Sample t-test
##
## data: kappa_long_df$logistic_model and kappa_long_df$penalized_model
## t = 0.53868, df = 10, p-value = 0.6019
## alternative hypothesis: true difference in means is not equal to 0
## 95 percent confidence interval:
## -0.1534413 0.2512897
## sample estimates:
## mean of x mean of y
## 0.4618727 0.4129486