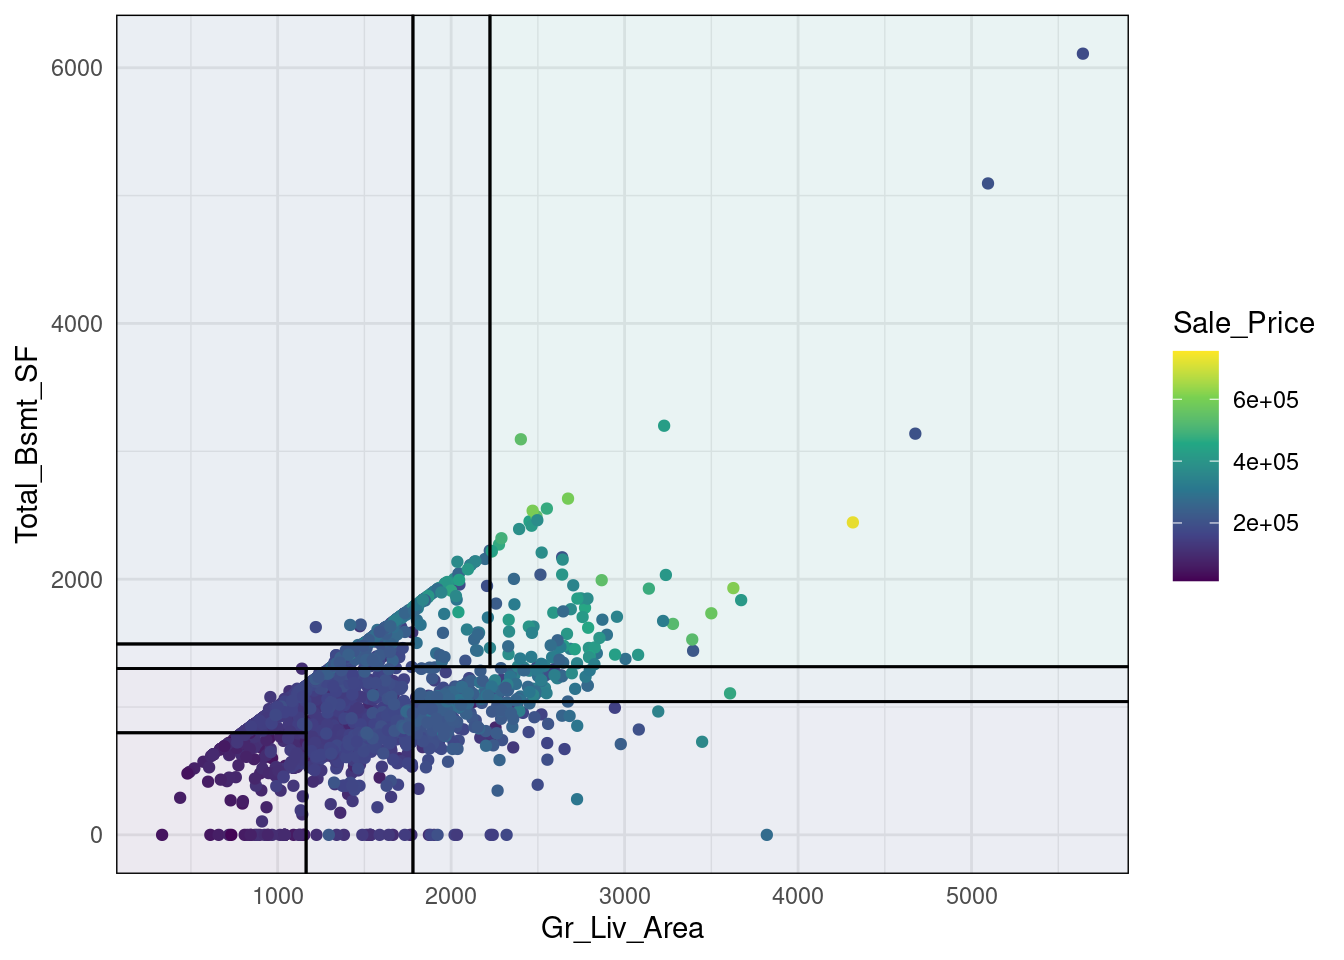
Another visualization into the decision tree space predictions.
p <- ames_train %>%
     ggplot(aes(x = Gr_Liv_Area, y = Total_Bsmt_SF)) +
     geom_point(aes(col = Sale_Price))

## Fit a decision tree using the same variables as the above plot
ames_dt4 <- rpart(Sale_Price ~ Gr_Liv_Area + Total_Bsmt_SF, data = ames_train)

p +
     geom_parttree(
          data = ames_dt4,
          aes(fill = Sale_Price),
          alpha = 0.1
     ) +
     scale_color_viridis_c(aesthetics = c('colour', 'fill'))