Feature interpretation
The vip package importance will measure the impact of the prediction error as a proportion of the total error features are included (Generalized cross-validation).
# variable importance plots
p1 <-
  vip(cv_mars, num_features = 40, geom = "point", value = "gcv") +
  ggtitle("GCV")

p2 <-
  vip(cv_mars, num_features = 40, geom = "point", value = "rss") +
  ggtitle("RSS")

gridExtra::grid.arrange(p1, p2, ncol = 2)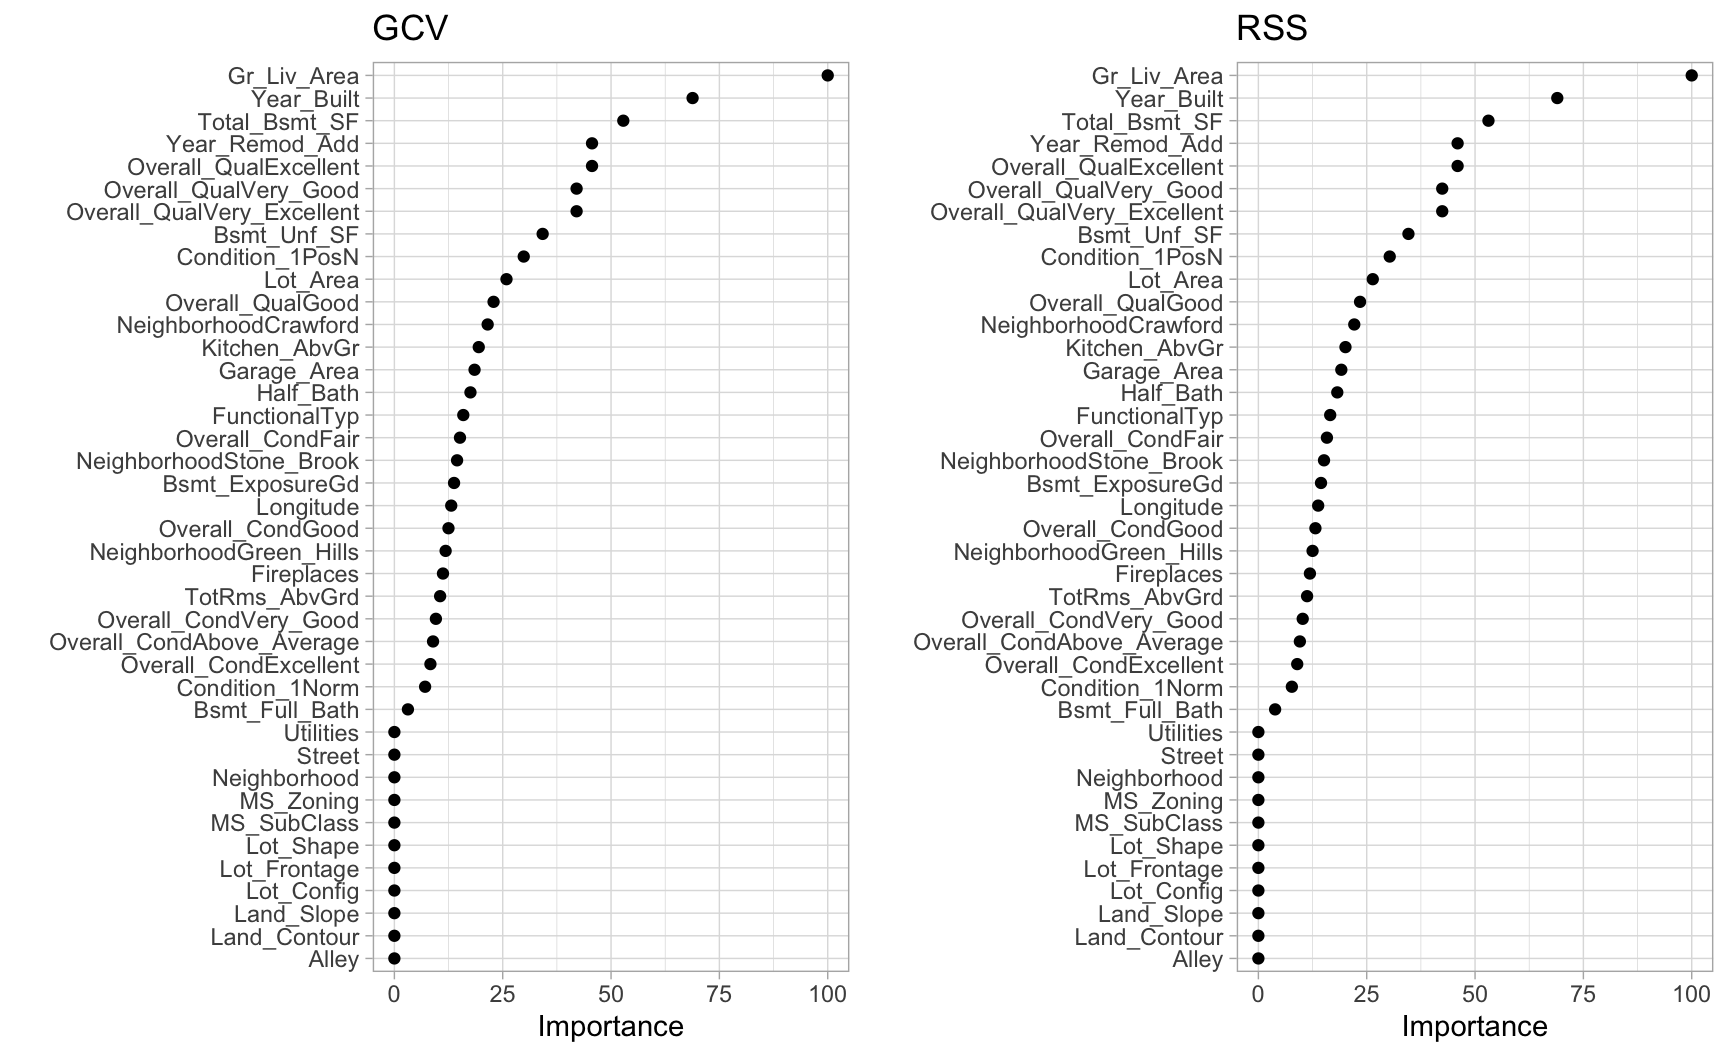
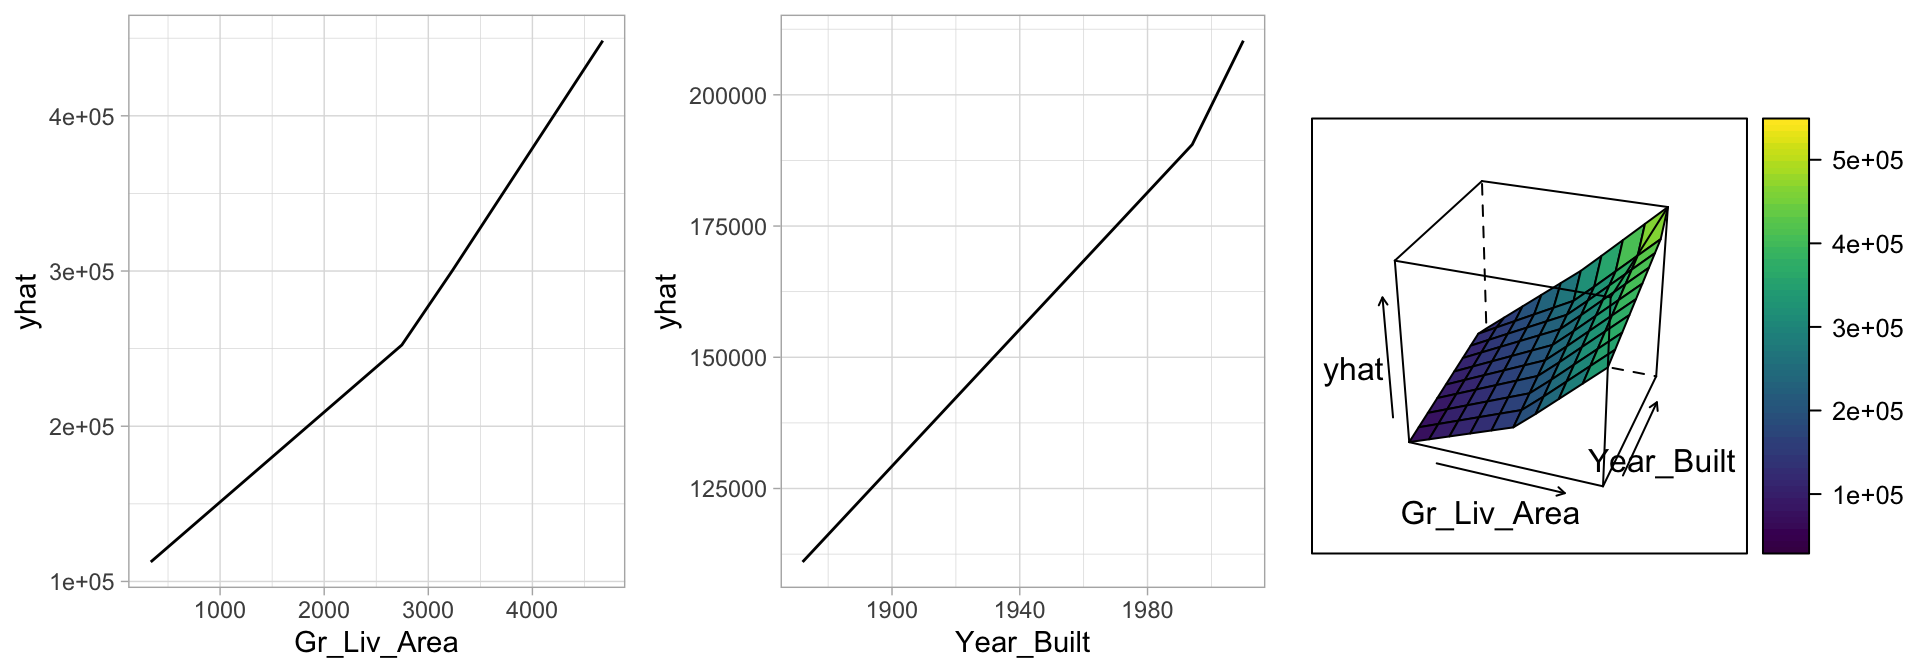
However, it does not measure the impact for particular hinge functions created for a given feature. To see the effect we need to create a plot for each predictor.
# Construct partial dependence plots
p1 <-
  partial(cv_mars, pred.var = "Gr_Liv_Area", grid.resolution = 10) |>
  autoplot()

p2 <-
  partial(cv_mars, pred.var = "Year_Built", grid.resolution = 10) |>
  autoplot()

p3 <-
  partial(cv_mars, pred.var = c("Gr_Liv_Area", "Year_Built"),
          grid.resolution = 10) %>%
  plotPartial(levelplot = FALSE, zlab = "yhat", drape = TRUE, colorkey = TRUE,
              screen = list(z = -20, x = -60))

# Display plots side by side
gridExtra::grid.arrange(p1, p2, p3, ncol = 3)