predictions %>%
# Adding original Sale_Price
tidyr::as_tibble() %>%
mutate(observation = 1:n(),
actual = ames_test$Sale_Price) %>%
# Transforming the data to long format
tidyr::gather(tree, predicted, -c(observation, actual)) %>%
# Transforming the tree column to integer to avoid problem arranging
# group_by(observation) %>%
# mutate(tree = stringr::str_extract(tree, '\\d+') %>% as.numeric()) %>%
# ungroup() %>%
mutate(tree = stringr::str_remove(tree, '^result\\.') %>% as.integer()) %>%
arrange(observation, tree) %>%
# For each observation Calculate the avg_prediction
# with different number of trees
group_by(observation) %>%
mutate(avg_prediction = cummean(predicted)) %>%
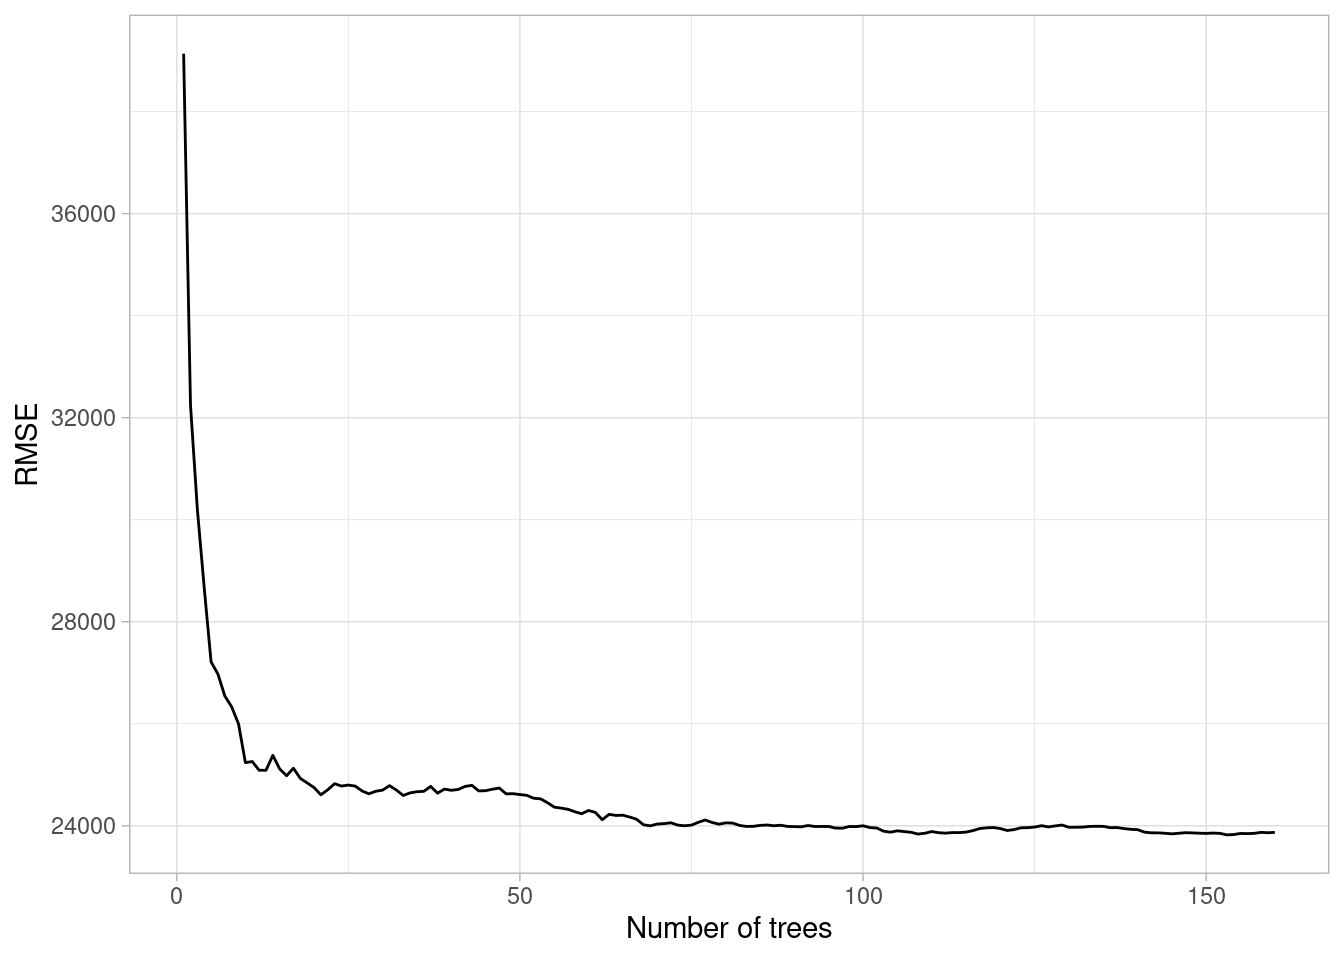
# Calculate the RMSE for each tree
group_by(tree) %>%
summarize(RMSE = RMSE(avg_prediction, actual)) %>%
# Plot the results
ggplot(aes(tree, RMSE)) +
geom_line() +
xlab('Number of trees')+
theme_light()