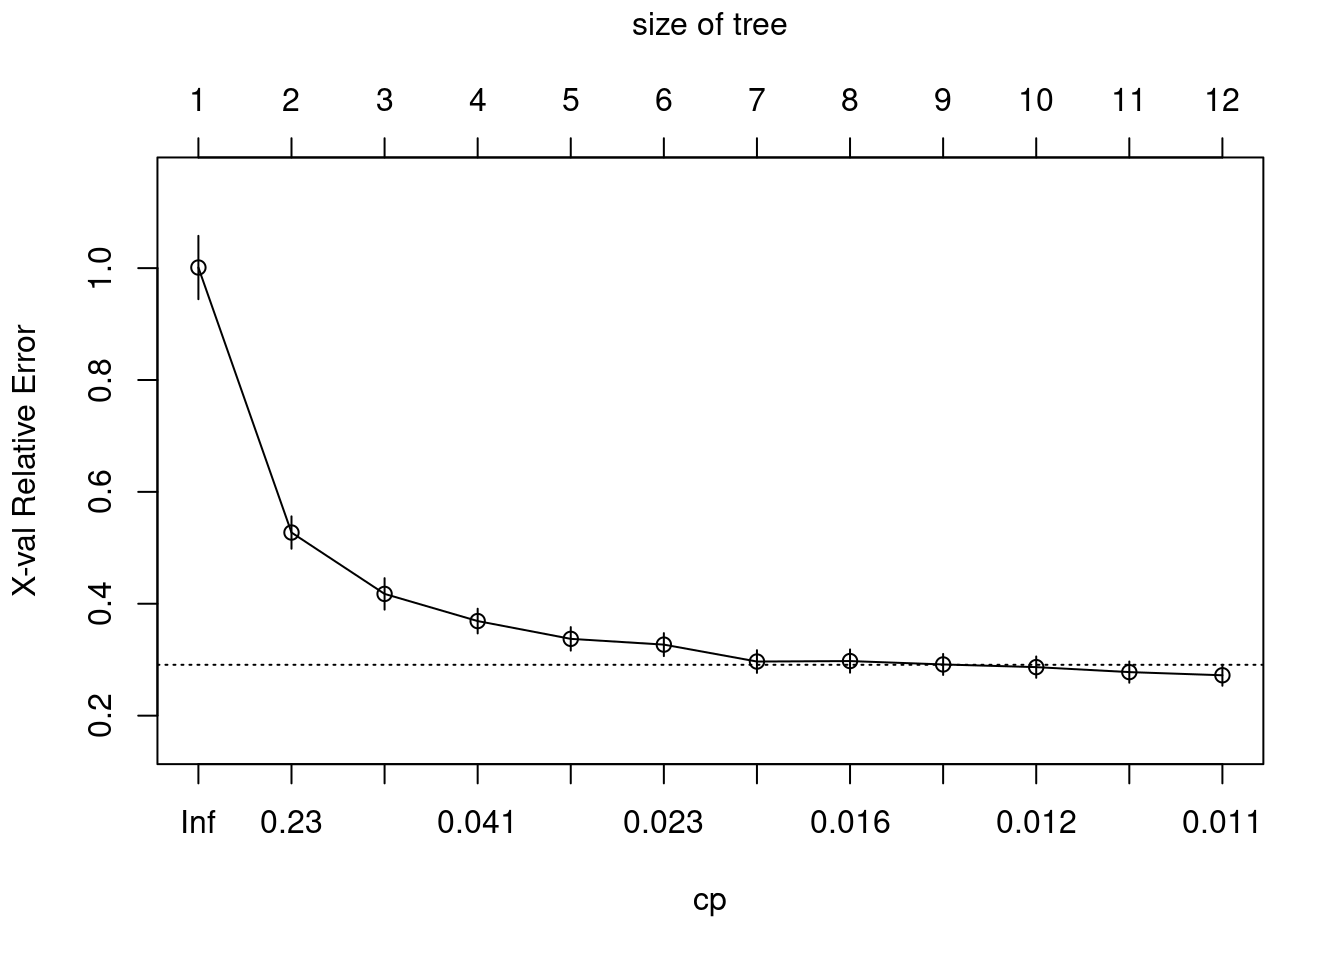
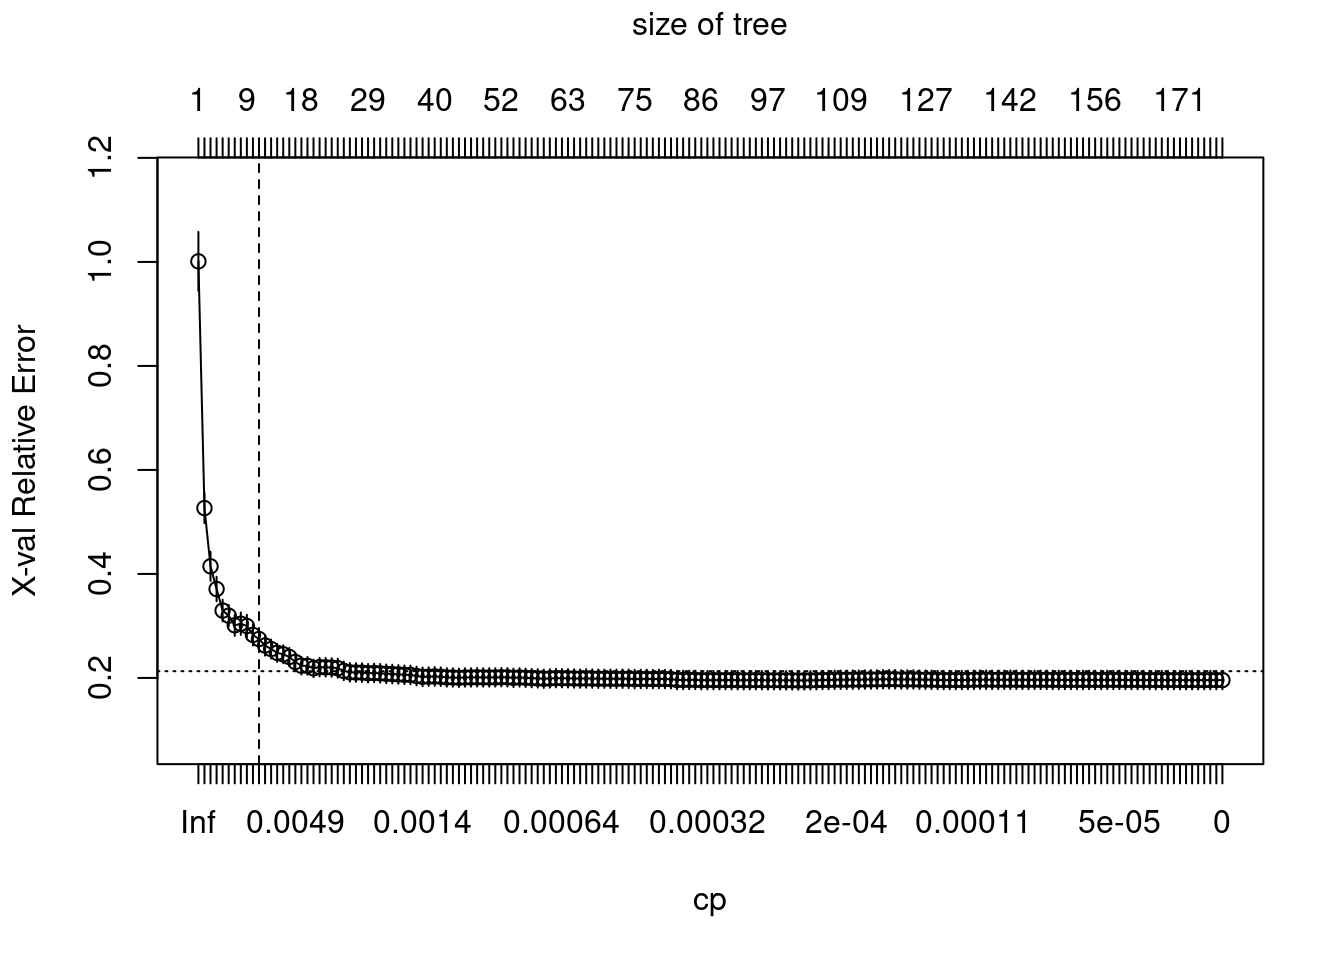
Plot cost complexity parameter to validation error
plotcp(ames_dt1)
Using the 1-SE (1 standard error) rule, a tree size of 10-12 provides optimal cross validation results.
Let’s update our decision tree inputing these parameters
ames_dt2 <- rpart(
    formula = Sale_Price ~ .,
    data    = ames_train,
    method  = "anova",
    control = list(cp = 0, xval = 10)
)

plotcp(ames_dt2)
abline(v = 11, lty = "dashed")
cp table
ames_dt1$cptable## CP nsplit rel error xerror xstd
## 1 0.47447176 0 1.0000000 1.0010912 0.05661504
## 2 0.11258635 1 0.5255282 0.5273262 0.02891307
## 3 0.06144216 2 0.4129419 0.4176107 0.02811953
## 4 0.02741384 3 0.3514997 0.3690610 0.02207443
## 5 0.02500852 4 0.3240859 0.3372497 0.02101588
## 6 0.02117890 5 0.2990774 0.3269645 0.02055165
## 7 0.01709753 6 0.2778985 0.2967136 0.02030173
## 8 0.01526499 7 0.2608009 0.2975709 0.02078263
## 9 0.01241470 8 0.2455360 0.2915154 0.01878416
## 10 0.01176358 9 0.2331213 0.2867136 0.01907614
## 11 0.01135317 10 0.2213577 0.2778336 0.01894936
## 12 0.01000000 11 0.2100045 0.2721801 0.01874506So, by default, rpart() is performing some automated tuning, with an optimal subtree of 10 total splits, 11 terminal nodes, and a cross-validated SSE of 0.2778.
# caret cross validation results
ames_dt3 <- train(
  Sale_Price ~ .,
  data = ames_train,
  method = "rpart",
  trControl = trainControl(method = "cv", number = 10),
  tuneLength = 20
)
## Warning in nominalTrainWorkflow(x = x, y = y, wts = weights, info = trainInfo,
## : There were missing values in resampled performance measures.g1 <- ggplot(ames_dt3)
plotly::ggplotly(g1)Cross-validated accuracy rate for the 20 different α parameter values in our grid search. Lower α values (deeper trees) help to minimize errors.
Best cp value
ames_dt3$bestTune## cp
## 1 0.004478693