Feature interpretation
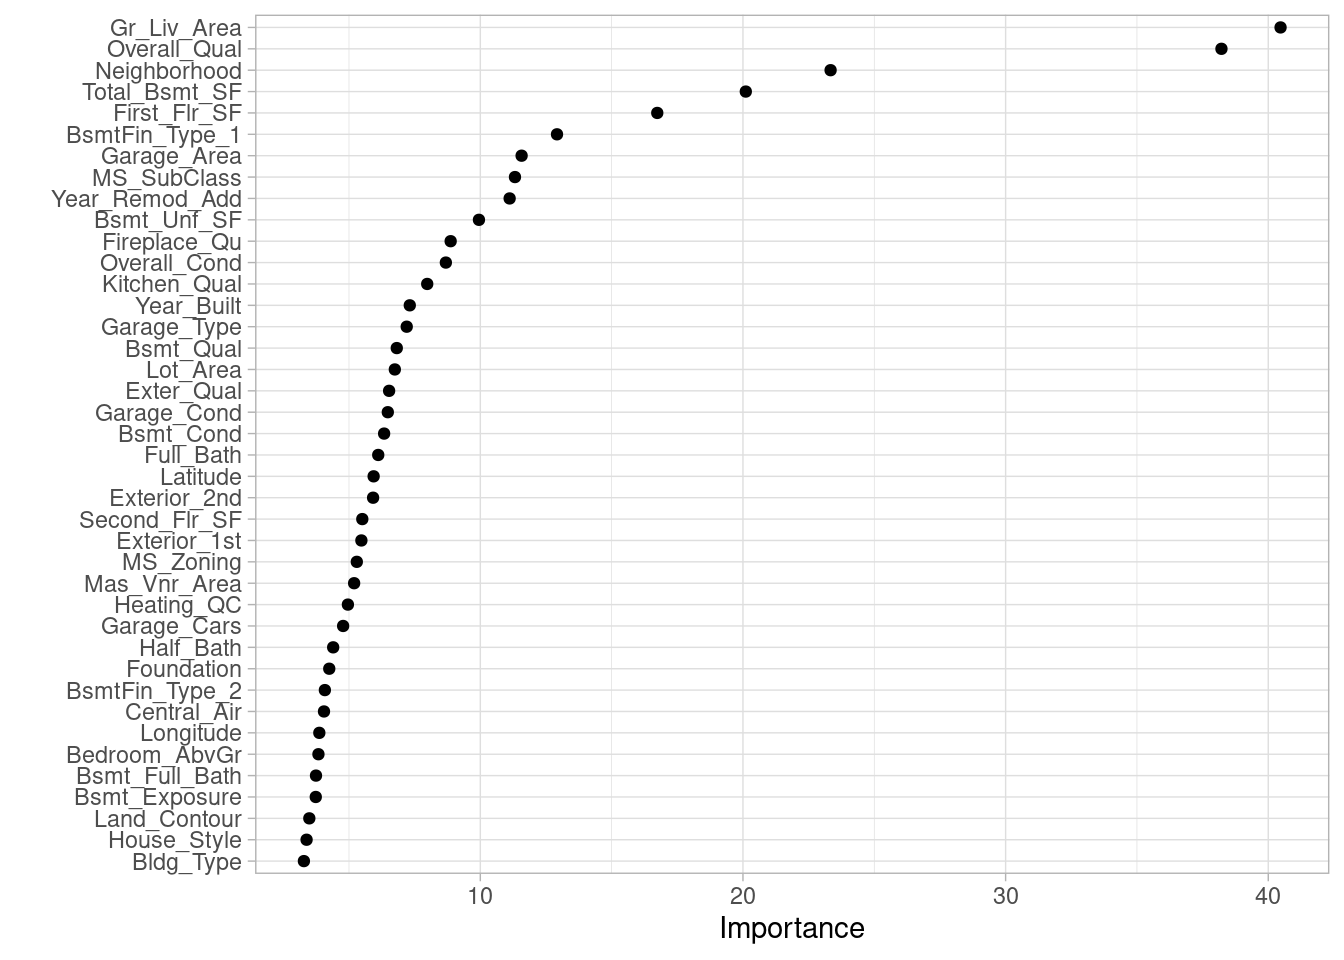
To infer how features are influencing our model is not enough just to measure feature importance based on the sum of the reduction in the loss function attributed to each variable at each split a single tree, then aggregate this measure across all trees for each feature.
Since we use many tree, we tend to have many more features involved but with lower levels of importance.
doParallel::registerDoParallel()

set.seed(454)
bagging_model_fit <-
  rand_forest(mtry = ncol(ames_train)-1L,
              trees = 200L,
              min_n = 2L) %>%
  set_engine("randomForest", importance = TRUE) %>%
  set_mode("regression") |>
  fit(Sale_Price ~ ., data = ames_train)

doParallel::stopImplicitCluster()

vip::vip(
  bagging_model_fit,
  num_features = 40,
  geom = "point"
)+
  theme_light()
Partial dependence plots (PDP) helps us to find non-linear relationships between a feature and response.
# Construct partial dependence plots
p1 <- pdp::partial(
  bagging_model_fit,
  pred.var = "Lot_Area",
  grid.resolution = 20,
  train = ames_train
  ) %>%
  autoplot()+
  theme_light()

p2 <- pdp::partial(
  bagging_model_fit,
  pred.var = "Lot_Frontage",
  grid.resolution = 20,
  train = ames_train
  ) %>%
  autoplot()+
  theme_light()

gridExtra::grid.arrange(p1, p2, nrow = 1)