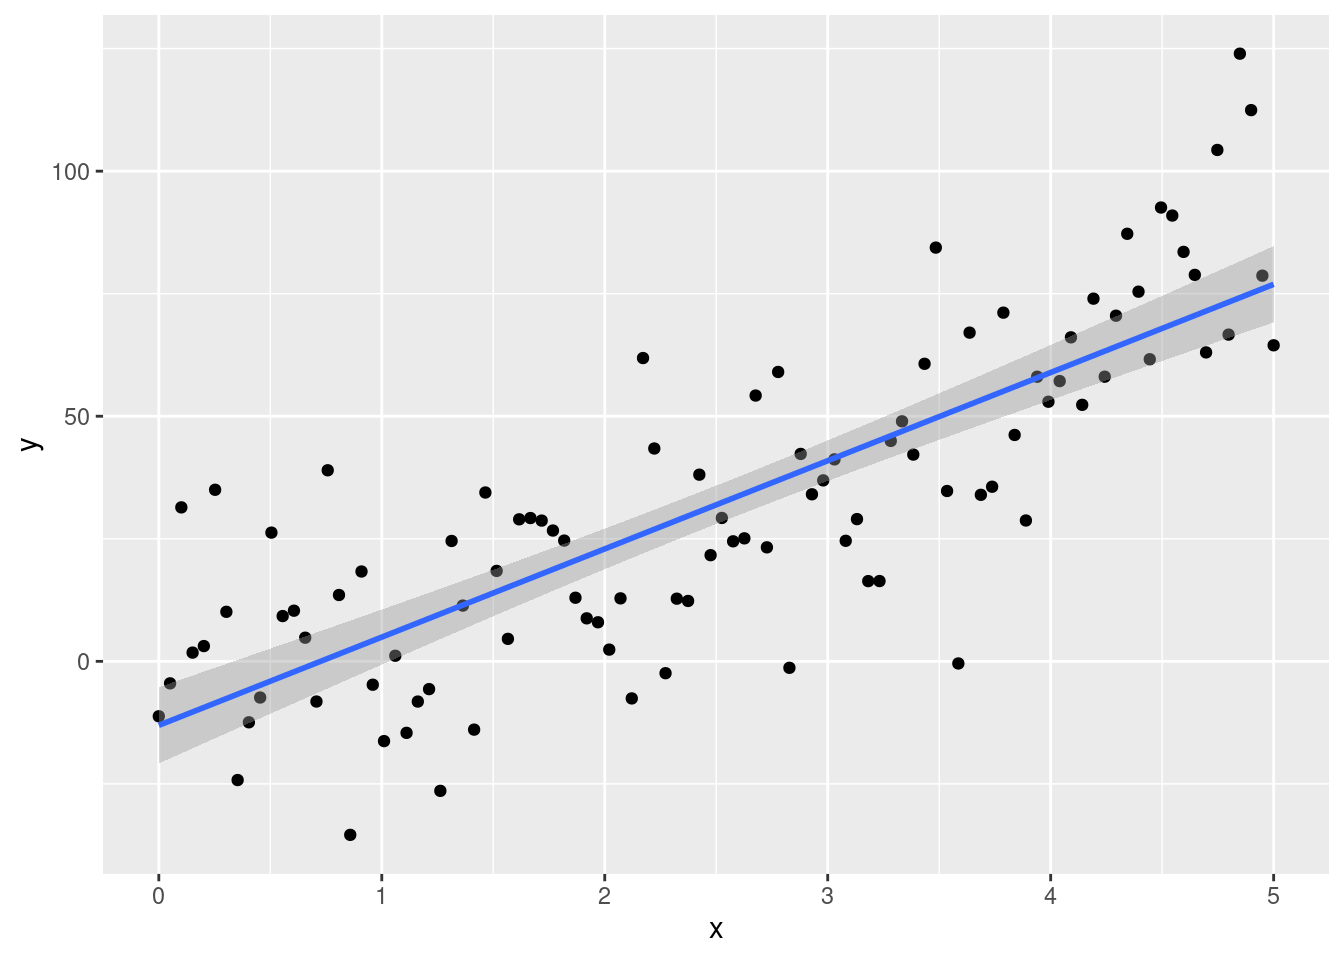
7.1 Linear Regression Model
Model: \(y_t=\beta_0+\beta_1x_t+\epsilon_t\)
\(\beta_0\) is the intercept \(\beta_1\) is the slope
set.seed(123)

# Generate x values
x <- seq(0, 5, length.out = 100)
# Generate y values with a positive linear slope
# y <- 2*x + rnorm(100, mean = 5, sd = 8)
y <-  2*x + 3*x^2 + rnorm(100, mean = 0, sd = 20)

df <- tibble(x,y)


df %>%
  ggplot(aes(x,y))+
  geom_point()+
  geom_smooth(method="lm")
## `geom_smooth()` using formula = 'y ~ x'