library(broom)
data_grouped <- dj_plot$data |> # pull data out of plot
group_by(Name)
player_names <- data_grouped |>
group_keys() |>
pull(Name)
regressions <- data_grouped |>
group_split() |>
map(~lm(OPS ~ I(Age - 30) + I((Age - 30) ^ 2), data = .)) |>
map(tidy) |>
set_names(player_names) |>
bind_rows(.id = "Name")
S <- regressions |>
group_by(Name) |>
summarize(
b1 = estimate[1],
b2 = estimate[2],
Curvature = estimate[3],
Age_max = round(30 - b2 / Curvature / 2, 1),
Max = round(b1 - b2 ^ 2 / Curvature / 4, 3)
)
library(ggrepel)
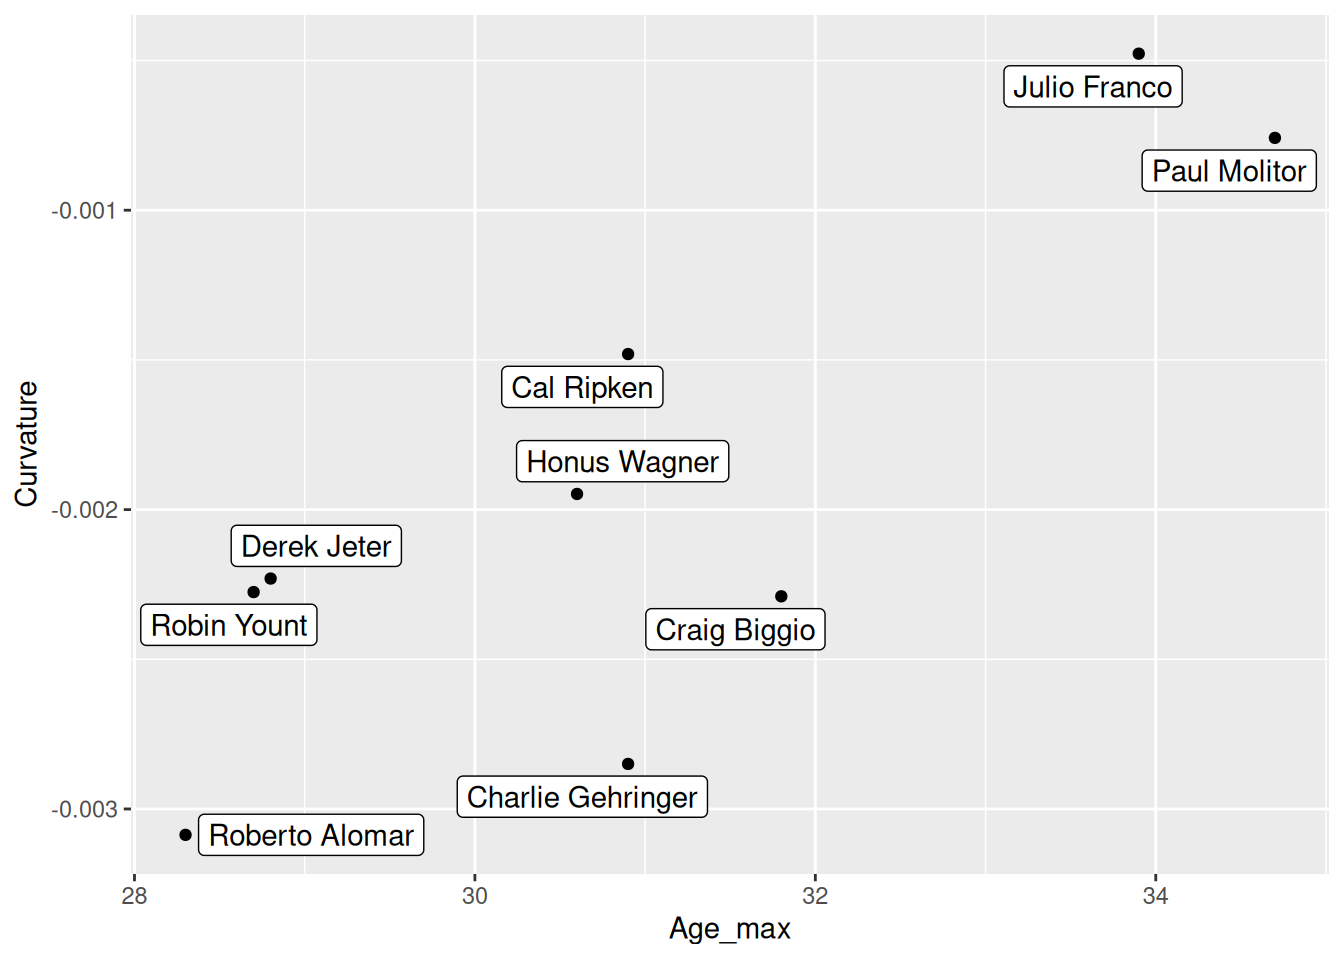
ggplot(S, aes(Age_max, Curvature, label = Name)) +
geom_point() + geom_label_repel()