Modeling Called Strike Percentage
- We use a Generalized Additive Model with binomial family
library(mgcv)
strike_mod <- gam(
  Outcome == "called_strike" ~ s(plate_x, plate_z),
  family = binomial,
  data = taken
)
library(broom)
hats <- strike_mod |>
augment(type.predict = "response")
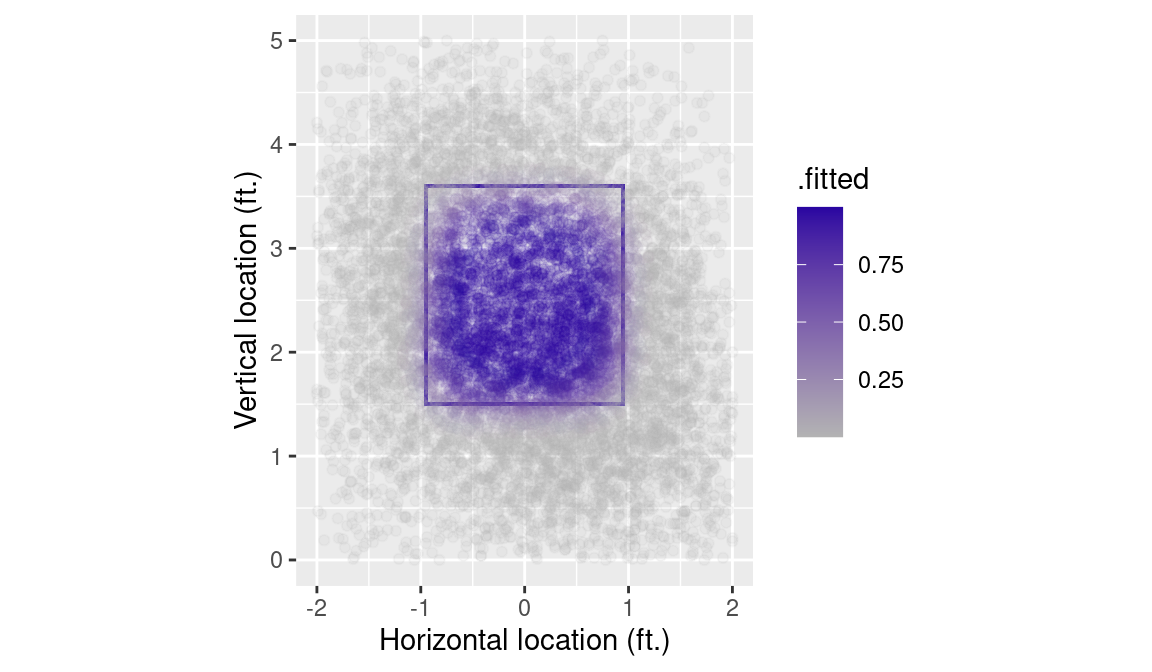
k_zone_plot %+% sample_n(hats, 10000) +
geom_point(aes(color = .fitted), alpha = 0.1) +
scale_color_gradient(low = "gray70", high = crcblue)
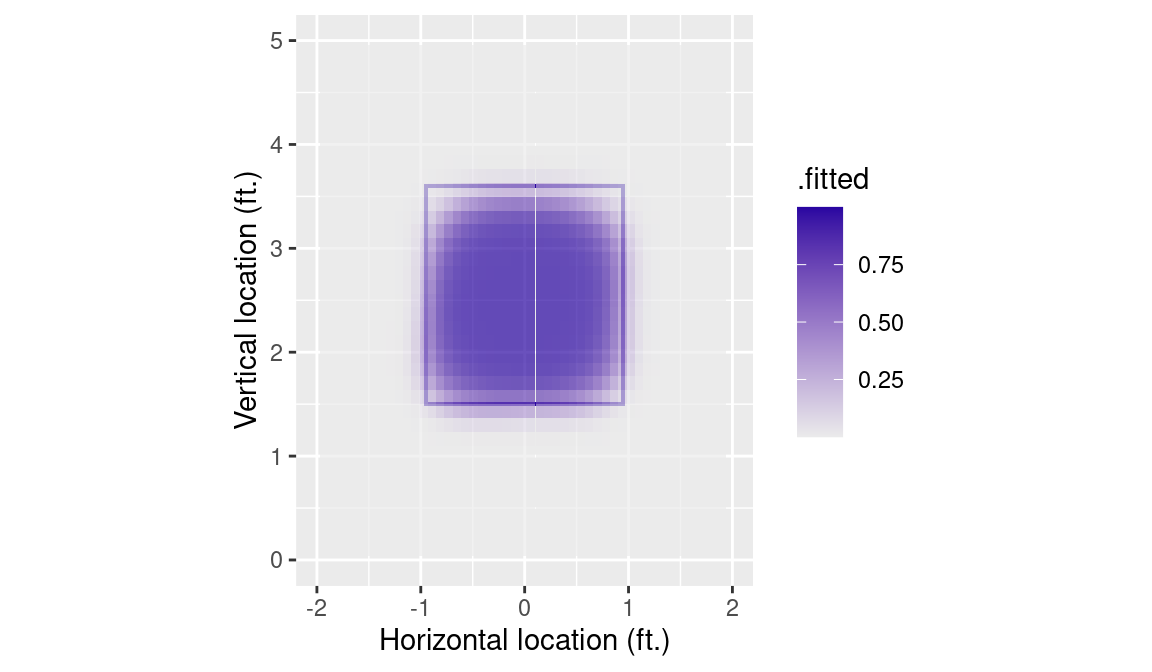
- We can build a continuous grid
library(modelr)
grid <- taken |>
  data_grid(
    plate_x = seq_range(plate_x, n = 100),
    plate_z = seq_range(plate_z, n = 100)
  )

grid_hats <- strike_mod |>
  augment(type.predict = "response", newdata = grid)

tile_plot <- k_zone_plot %+% grid_hats +
  geom_tile(aes(fill = .fitted), alpha = 0.7) +
  scale_fill_gradient(low = "gray92", high = crcblue)
tile_plot
- Batter and pitcher handedness may have an effect, let’s add it to our GAM
hand_mod <- gam(
  Outcome == "called_strike" ~
    p_throws + stand + s(plate_x, plate_z),
  family = binomial,
  data = taken
)

hand_grid <- taken |>
  data_grid(
    plate_x = seq_range(plate_x, n = 100),
    plate_z = seq_range(plate_z, n = 100),
    p_throws,
    stand
  )
hand_grid_hats <- hand_mod |>
  augment(type.predict = "response", newdata = hand_grid)

diffs <- hand_grid_hats |>
  group_by(plate_x, plate_z) |>
  summarize(
    N = n(),
    .fitted = sd(.fitted),
    .groups = "drop"
  )
tile_plot %+% diffs
