Local Patterns of Statcast Launch Velocity
sc_2017_ls <- readr::read_rds(here::here("data/statcast_2017.rds"))
sc_ip2017 <- sc_2017_ls |>
  dplyr::filter(type == "X")
launch_speeds <- sc_ip2017 |>
  dplyr::group_by(player_name, game_date) |>
  dplyr::arrange(game_date) |>
  dplyr::summarize(
    bip = dplyr::n(),
    sum_LS = sum(launch_speed)
  )
## `summarise()` has grouped output by 'player_name'. You can override using the
## `.groups` argument.ls_250 <- sc_ip2017 |>
dplyr::group_by(player_name) |>
dplyr::summarize(total_bip = dplyr::n()) |>
dplyr::filter(total_bip >= 250) |>
dplyr::inner_join(launch_speeds, by = "player_name")regroup <- function(data, group_size) {
out <- data |>
dplyr::mutate(
id = dplyr::row_number() - 1,
group_id = floor(id / group_size)
)
# hack to avoid a small leftover bin!
if (nrow(data) %% group_size != 0) {
max_group_id <- max(out$group_id)
out <- out |>
dplyr::mutate(
group_id = dplyr::if_else(
group_id == max_group_id, group_id - 1, group_id
)
)
}
out |>
dplyr::group_by(group_id) |>
dplyr::summarize(
G = dplyr::n(), bip = sum(bip), sum_LS = sum(sum_LS)
)
}We focus on A.J. Pollock’s data
aj <- ls_250 |>
  dplyr::filter(player_name == "A.J. Pollock") |>
  dplyr::arrange(game_date)
aj |>
  regroup(5)  |>
  dplyr::slice_head(n = 5)
## # A tibble: 0 × 4
## # ℹ 4 variables: group_id <dbl>, G <int>, bip <int>, sum_LS <dbl>summarize_streak_data <- function(data, name, group_size = 5) {
data |>
dplyr::filter(player_name == name) |>
dplyr::arrange(game_date) |>
regroup(group_size) |>
dplyr::summarize(
balls_in_play = sum(bip),
Mean = mean(sum_LS / bip, na.rm = TRUE),
SD = sd(sum_LS / bip, na.rm = TRUE)
)
}Mean and SD for A.J. Pollock
## # A tibble: 1 × 3
## balls_in_play Mean SD
## <int> <dbl> <dbl>
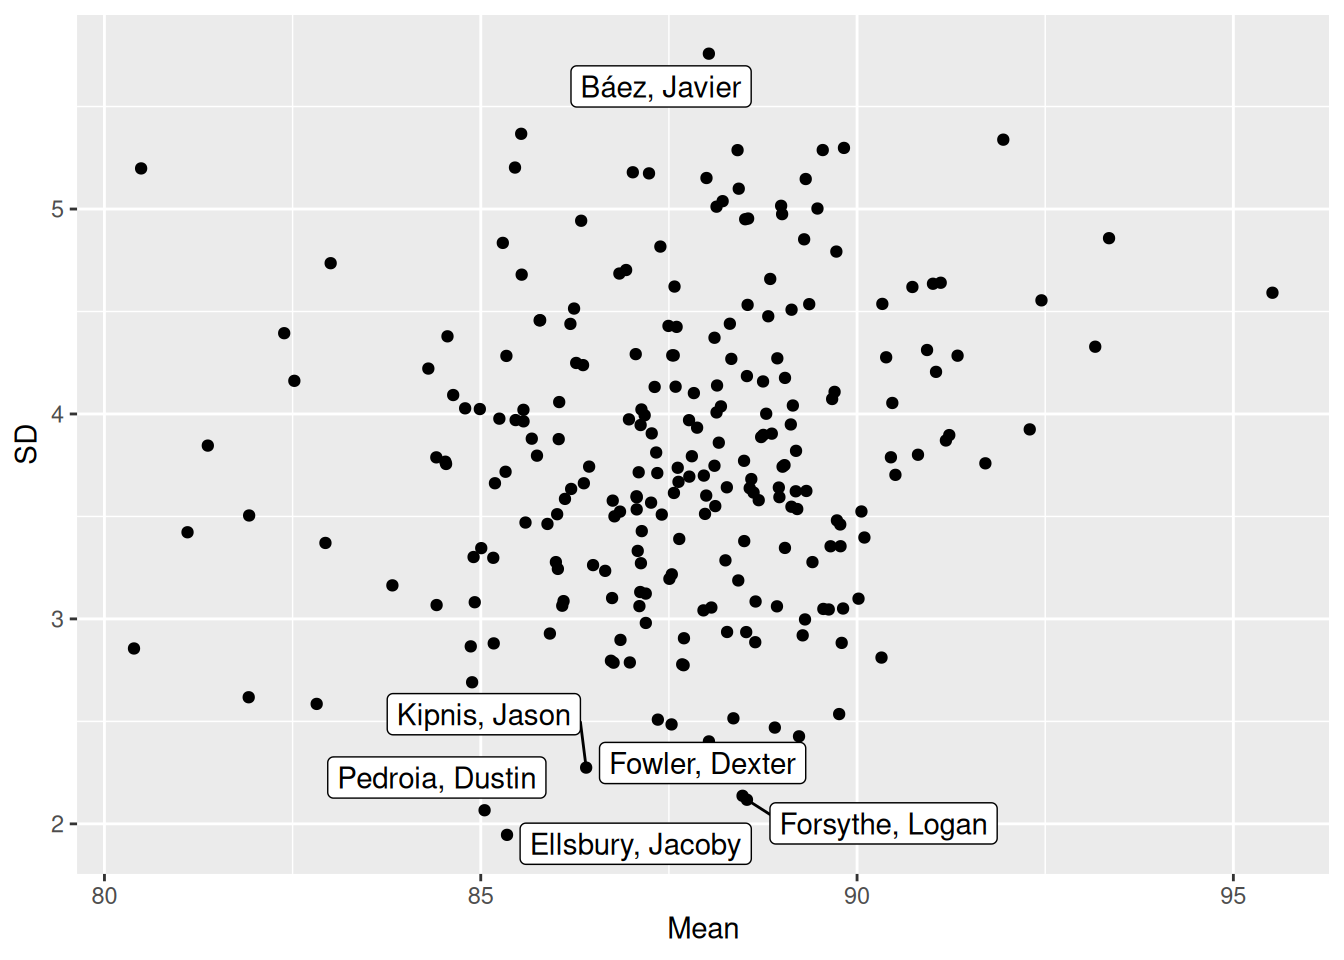
## 1 0 NaN NALet’s look at all the players (with at least 250 ABs)
player_list <- ls_250 |>
  dplyr::pull(player_name) |>
  unique()
results <- player_list |>
  purrr::map(summarize_streak_data, data = ls_250) |>
  purrr::list_rbind() |>
dplyr::mutate(Player = player_list)library(ggrepel)
ggplot2::ggplot(results, ggplot2::aes(Mean, SD)) +
ggplot2::geom_point() +
ggrepel::geom_label_repel(
data = dplyr::filter(results, SD > 5.63 | SD < 2.3 ),
ggplot2::aes(label = Player)
)
A new function to get average launch speed over a given game window
get_streak_data <- function(data, name, group_size = 5) {
  data |>
    dplyr::filter(player_name == name) |>
    dplyr::arrange(game_date) |>
    regroup(group_size) |>
    dplyr::mutate(
      launch_speed_avg = sum_LS / bip,
      Period = dplyr::row_number()
    )
}
streaky <- c("Michael Conforto", "Dexter Fowler") |>
purrr::set_names() |>
purrr::map(get_streak_data, data = ls_250) |>
purrr::list_rbind(names_to = "Player")
ggplot2::ggplot(streaky, ggplot2::aes(Period, launch_speed_avg)) +
ggplot2::geom_line(linewidth = 1) +
ggplot2::facet_wrap(vars(Player), ncol = 1)