5.5 José Altuve
Isolate to batting plays where Altuve was the hitter
How did Altuve do in his first three plate appearances in the 2016 season with the Houston Astros?
## # A tibble: 3 × 3
##   state new_state run_value
##   <chr> <chr>         <dbl>
## 1 000 1 000 2        -0.162
## 2 000 1 100 1         0.244
## 3 000 1 000 2        -0.162
2 primary questions:
What were the runner/outs situations for the player’s plate appearances?
What did the batter do with these opportunities to score runs?
Runner states to understand opportunities
## # A tibble: 8 × 2
##   bases     N
##   <chr> <int>
## 1 000     417
## 2 001      24
## 3 010      60
## 4 011      18
## 5 100     128
## 6 101      22
## 7 110      40
## 8 111       8
Most often batting with bases empty or runner only on first
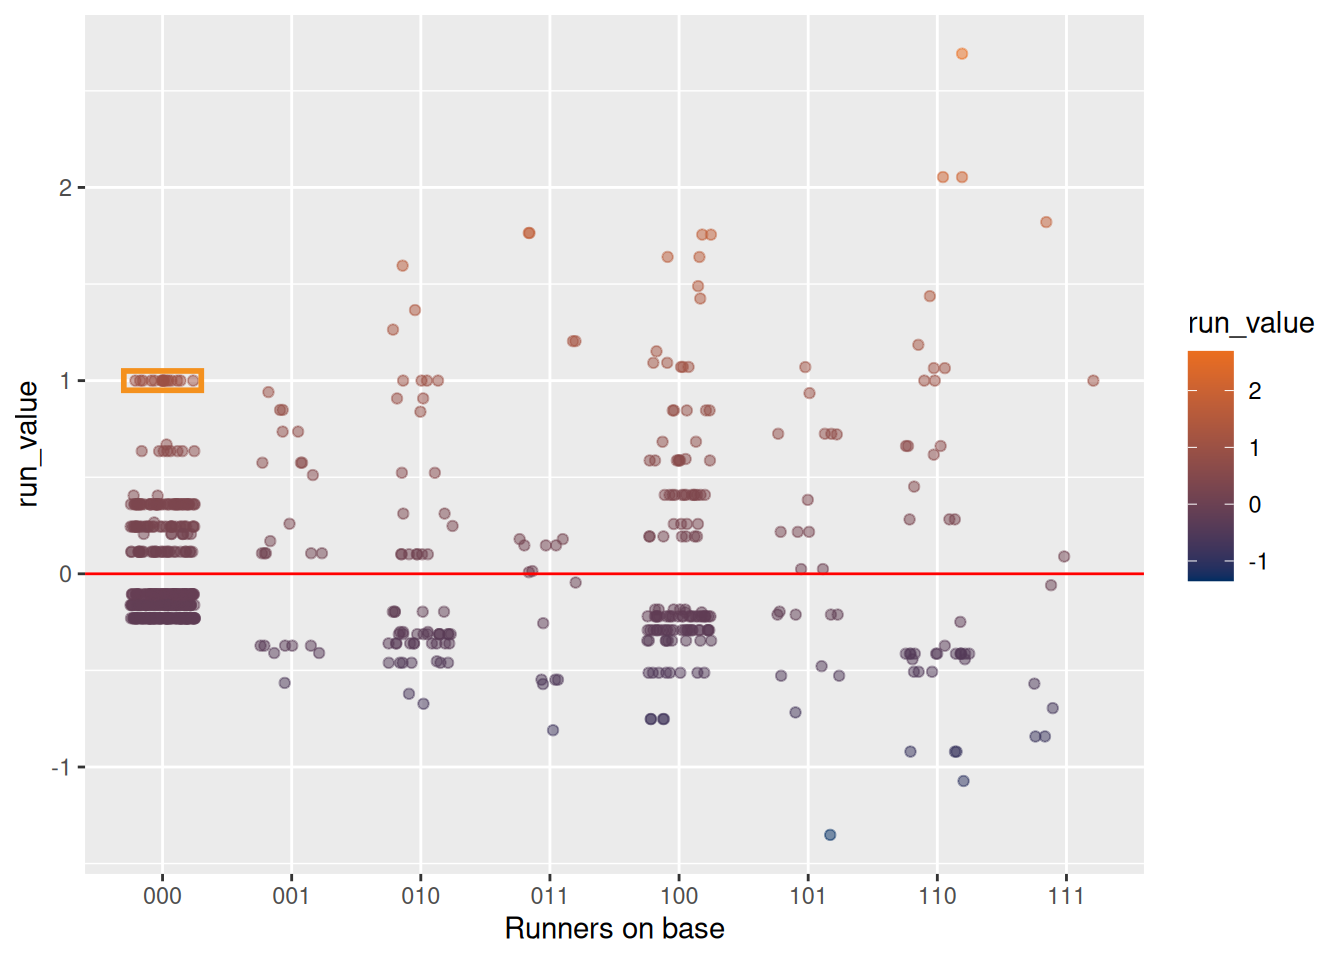
Performance with these opportunities:
When bases empty- range of runs was small
Other situations- much more variation
Total run production for 2016
Number of opportunities and sum of run values for each situation
runs_altuve <- altuve |>
  group_by(bases) |>
  summarize(
    PA = n(),
    total_run_values = sum(run_value)
  )
runs_altuve
## # A tibble: 8 × 3
## bases PA total_run_values
## <chr> <int> <dbl>
## 1 000 417 10.1
## 2 001 24 4.06
## 3 010 60 0.0695
## 4 011 18 3.43
## 5 100 128 10.2
## 6 101 22 1.34
## 7 110 40 5.62
## 8 111 8 -0.0968Total contribution at bat with bases empty: 10.10 runs
Didn’t do well with runners in scoring position
Total contribution for 2016 season (run expectancy change over 24 base/out states):
## # A tibble: 1 × 1
##    RE24
##   <dbl>
## 1  34.7