5.6 Opportunity and Success for All Hitters
Comparing run estimates to evaluate player batting effectiveness
Different players have different opportunities to create runs (batting order)
Performance by season:
Total number of plate appearances
Sum of runs potentials
Sum of the run values
Focus on batters 400+ plate appearances
## # A tibble: 6 × 4
## bat_id RE24 PA runs_start
## <chr> <dbl> <int> <dbl>
## 1 abrej003 13.6 695 336.
## 2 alony001 -5.28 532 249.
## 3 altuj001 34.7 717 346.
## 4 andet001 -11.5 431 205.
## 5 andre001 17.7 568 257.
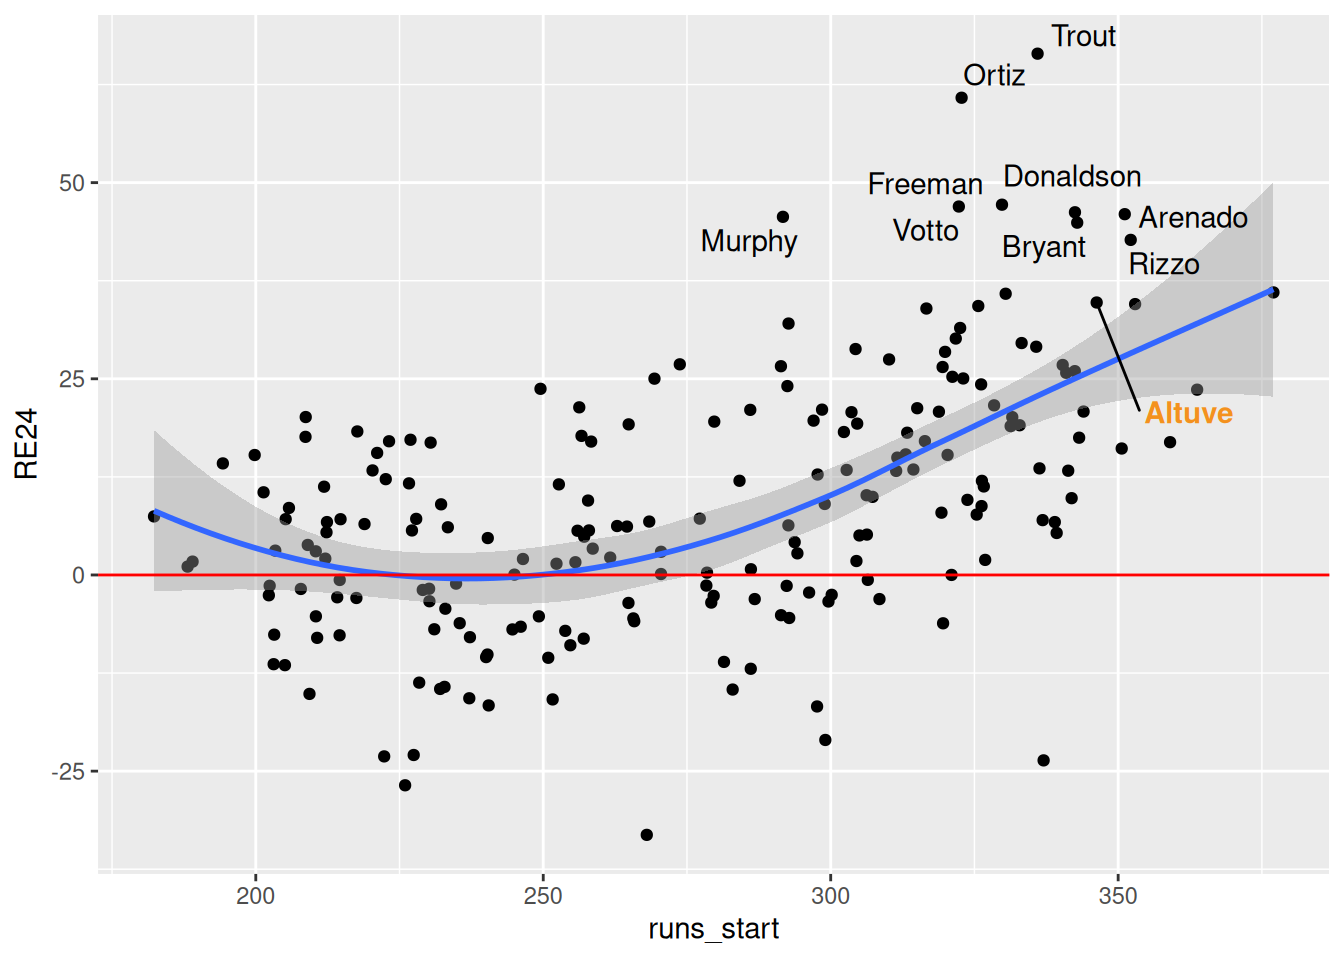
## 6 aokin001 -1.91 467 229.Is there a relationship between batters’ opportunities and their success in converting opportunities to runs?
## `geom_smooth()` using method = 'loess' and formula = 'y ~ x'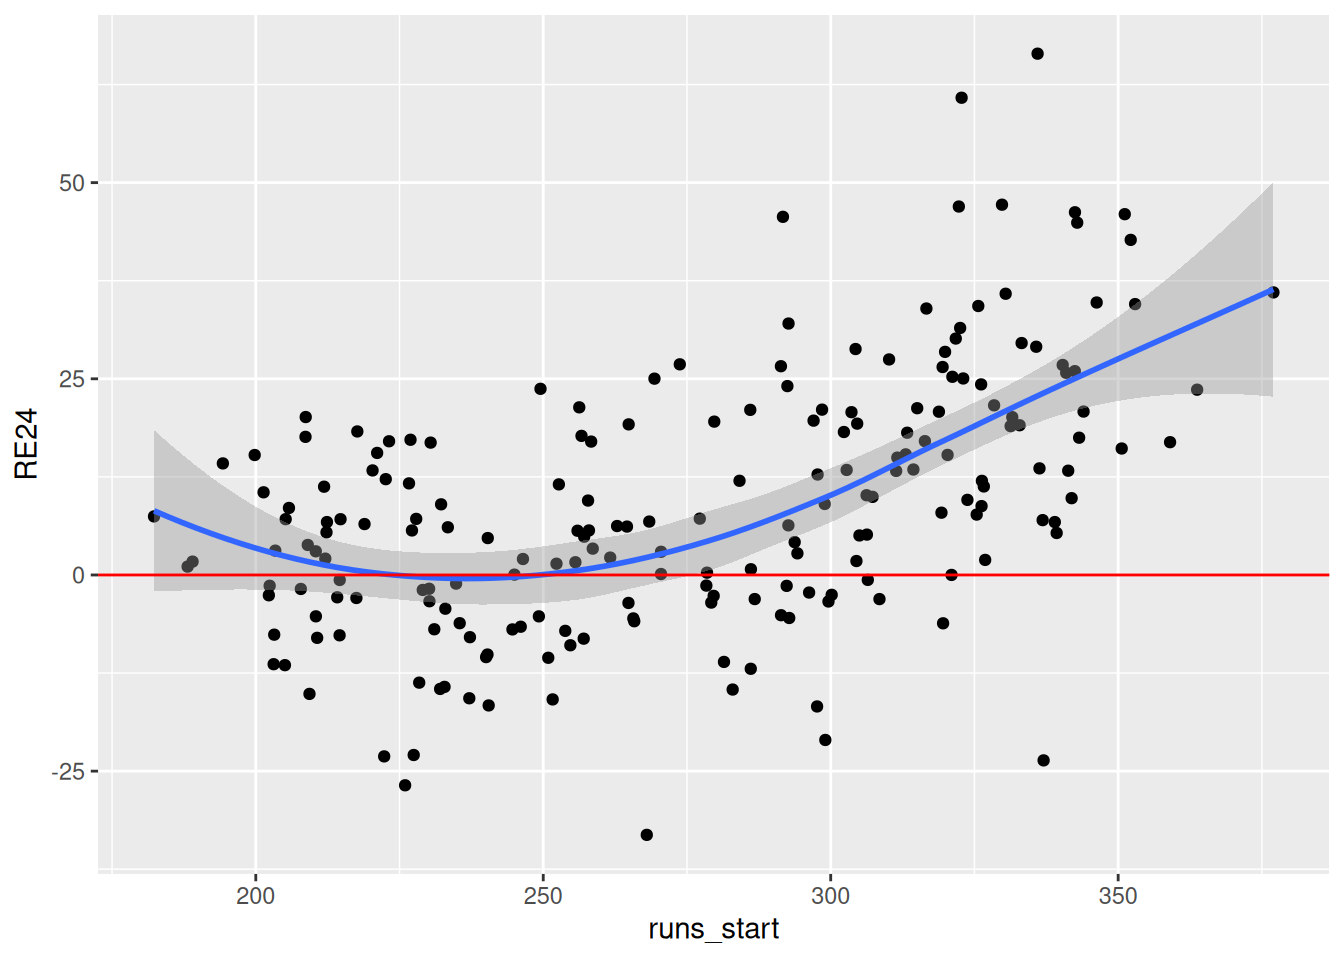
Batters with larger runs start values tend to have larger run contributions but there is a wide spread
## `geom_smooth()` using method = 'loess' and formula = 'y ~ x'