4.4 Correlation
In short, we may want correlation values close to 1.0 or -1.0.
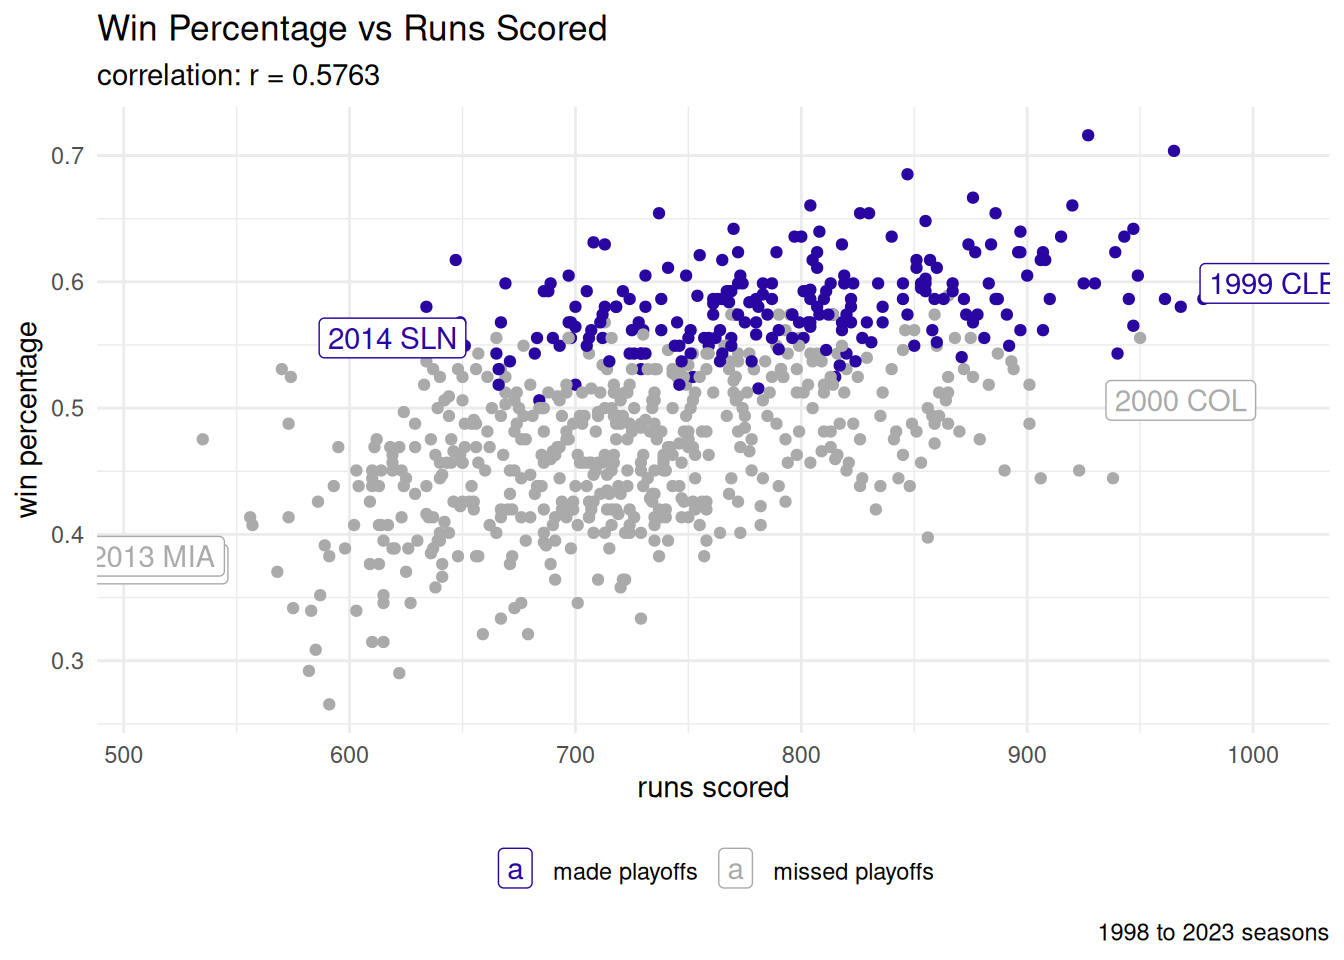
4.4.1 Offense
graph code
cor_value = cor(ch4_data$R, ch4_data$Wpct,
                use = "pairwise.complete.obs")

subset_for_labels <- ch4_data |>
  select(R, Wpct, playoff_bool, yearID, teamID) |>
  group_by(playoff_bool) |>
  mutate(highlight = ifelse(
    R == max(R) | R == min(R),
    1, 0
  )) |>
  ungroup() |>
  filter(highlight == 1) |>
  mutate(year_team = paste(yearID, teamID))

ch4_data |>
  ggplot(aes(x = R, y = Wpct)) +
  geom_point(aes(color = playoff_bool)) +
  geom_label(aes(x = R, y = Wpct, color = playoff_bool, label = year_team),
             data = subset_for_labels) +
  labs(title = "Win Percentage vs Runs Scored",
       subtitle = paste0("correlation: r = ", round(cor_value, 4)),
       caption = "1998 to 2023 seasons",
       x = "runs scored",
       y = "win percentage") +
  scale_color_manual(values = c("#2905A1", "#AAAAAA")) +
  theme_minimal() +
  theme(legend.position = "bottom",
        legend.title=element_blank())
4.4.2 Defense
graph code
cor_value = cor(ch4_data$RA, ch4_data$Wpct,
use = "pairwise.complete.obs")
subset_for_labels <- ch4_data |>
select(RA, Wpct, playoff_bool, yearID, teamID) |>
group_by(playoff_bool) |>
mutate(highlight = ifelse(
RA == max(RA) | RA == min(RA),
1, 0
)) |>
ungroup() |>
filter(highlight == 1) |>
mutate(year_team = paste(yearID, teamID))
ch4_data |>
ggplot(aes(x = RA, y = Wpct)) +
geom_point(aes(color = playoff_bool)) +
geom_label(aes(x = RA, y = Wpct, color = playoff_bool, label = year_team),
data = subset_for_labels) +
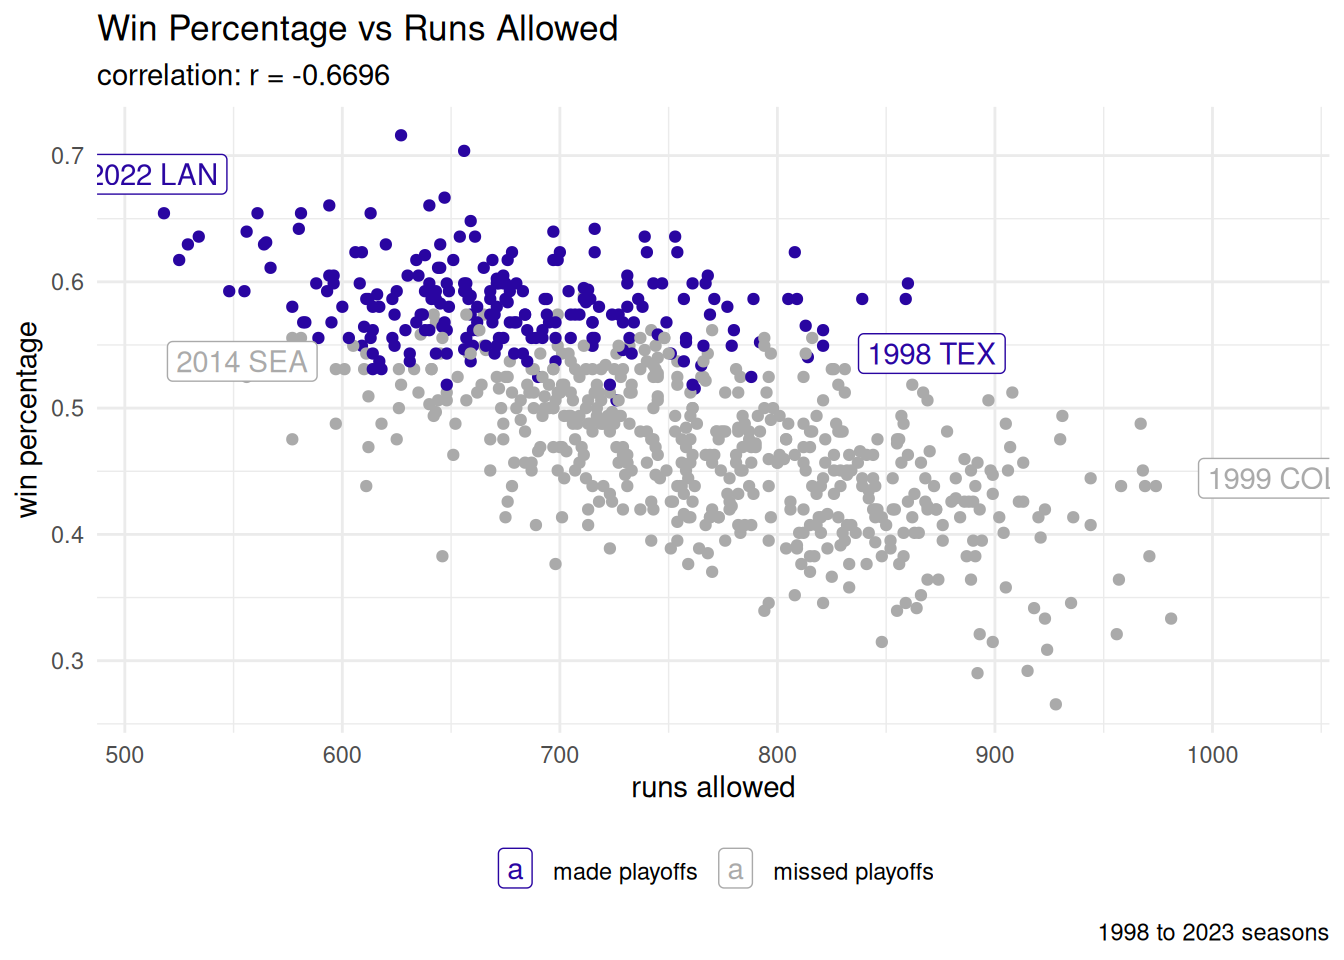
labs(title = "Win Percentage vs Runs Allowed",
subtitle = paste0("correlation: r = ", round(cor_value, 4)),
caption = "1998 to 2023 seasons",
x = "runs allowed",
y = "win percentage") +
scale_color_manual(values = c("#2905A1", "#AAAAAA")) +
theme_minimal() +
theme(legend.position = "bottom",
legend.title=element_blank())4.4.3 Run Differential
graph code
cor_value = cor(ch4_data$RD, ch4_data$Wpct,
use = "pairwise.complete.obs")
subset_for_labels <- ch4_data |>
select(RD, Wpct, playoff_bool, yearID, teamID) |>
group_by(playoff_bool) |>
mutate(highlight = ifelse(
RD == max(RD) | RD == min(RD),
1, 0
)) |>
ungroup() |>
filter(highlight == 1) |>
mutate(year_team = paste(yearID, teamID))
ch4_data |>
ggplot(aes(x = RD, y = Wpct)) +
geom_point(aes(color = playoff_bool)) +
geom_label(aes(x = RD, y = Wpct, color = playoff_bool, label = year_team),
data = subset_for_labels) +
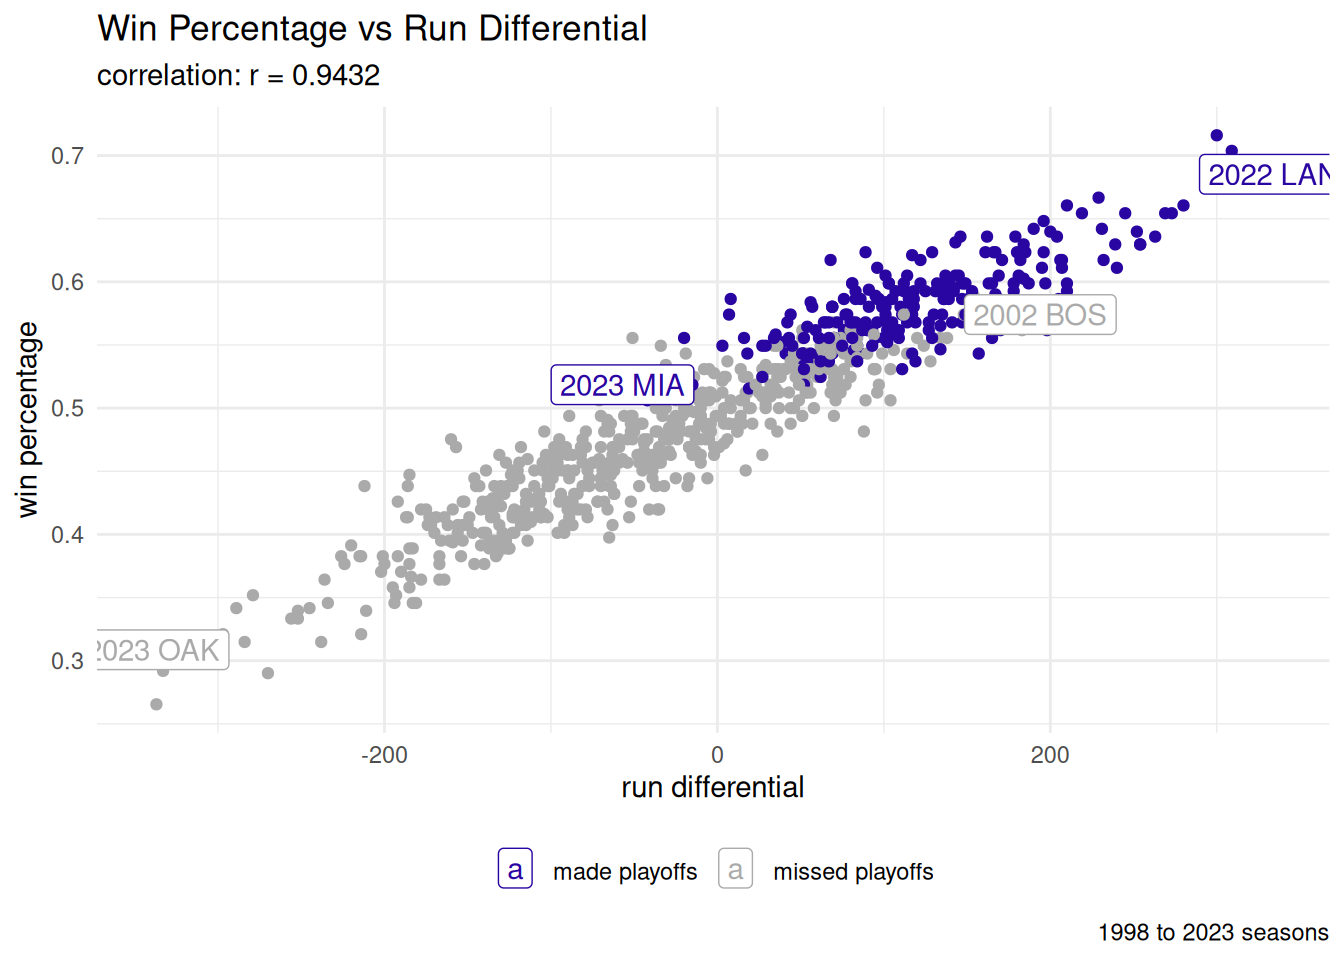
labs(title = "Win Percentage vs Run Differential",
subtitle = paste0("correlation: r = ", round(cor_value, 4)),
caption = "1998 to 2023 seasons",
x = "run differential",
y = "win percentage") +
scale_color_manual(values = c("#2905A1", "#AAAAAA")) +
theme_minimal() +
theme(legend.position = "bottom",
legend.title=element_blank())