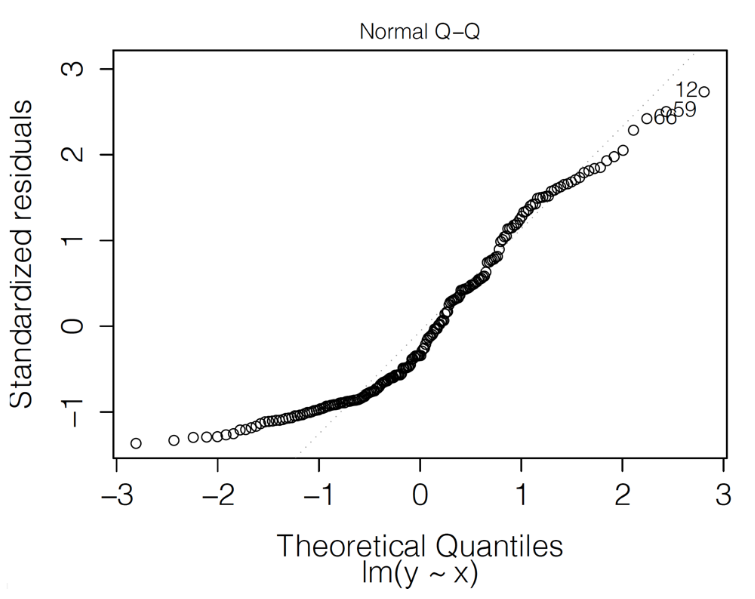
Standardized residuals \(\tilde{r}_i\) in function of values expected from the standard normal distribution
If the normality assumption is fulfilled, the plot should show a scatter of points close to the \(45^{\circ}\) diagonal, but this not the case.