7.3 Realistic Example Using Titanic Dataset
This section shows manual calculations of variable importance using a random forest model on the Titanic dataset.
The explanations relate to fictitious passenger, Johnny D, described in an earlier chapter.
Table 7.2: Variable and Interaction Contributions
Column descriptions:
- Column 1 - Variable or paired variable
- Column 2 - Paired-variable contributions
- Column 3 - Net interaction effect - calculated using columns 2 and 4
- Column 4 - Single variable contributions
| Variable | \(\Delta^{\{i,j\}|\emptyset}(\underline{x}_*)\) | \(\Delta_{I}^{\{i,j\}}(\underline{x}_*)\) | \(\Delta^{i|\emptyset}(\underline{x}_*)\) |
|---|---|---|---|
| age | 0.270 | ||
| fare:class | 0.098 | -0.231 | |
| class | 0.185 | ||
| fare:age | 0.249 | -0.164 | |
| fare | 0.143 | ||
| gender | -0.125 | ||
| age:class | 0.355 | -0.100 | |
| age:gender | 0.215 | 0.070 | |
| fare:gender | |||
| embarked | -0.011 | ||
| embarked:age | 0.269 | 0.010 | |
| parch:gender | -0.136 | -0.008 | |
| sibsp | 0.008 | ||
| sibsp:age | 0.284 | 0.007 | |
| sibsp:class | 0.187 | -0.006 | |
| embarked:fare | 0.138 | 0.006 | |
| sibsp:gender | -0.123 | -0.005 | |
| fare:parch | 0.145 | 0.005 | |
| parch:sibsp | 0.001 | -0.004 | |
| parch | -0.003 | ||
| parch:age | 0.264 | -0.002 | |
| embarked:gender | -0.134 | 0.002 | |
| embarked:parch | -0.012 | 0.001 | |
| fare:sibsp | 0.152 | 0.001 | |
| embarked:class | 0.173 | -0.001 | |
| gender:class | 0.061 | 0.001 | |
| embarked:sibsp | -0.002 | 0.001 | |
| parch:class | 0.183 | 0.000 |
Example Calculation for Net Interaction Effect of Age:Fair
- fare contribution (column 4) = 0.143
- age contribution (column 4) = 0.270
- fair:age contribution (column 2) = 0.249
- Net interaction = 0.249 - 0.143 - 0.270 = -0.164
Steps for Calculating Variable Importance Tables and Breakdown Plots
- Rank and sort variables and interaction net effects according to absolute value of contributions–see Table 2.
- Each variable should only appear once, either as a single variable or as part of an interaction effect. Keep top contribution only.
- Calculate variable importance measure as described in chapter six
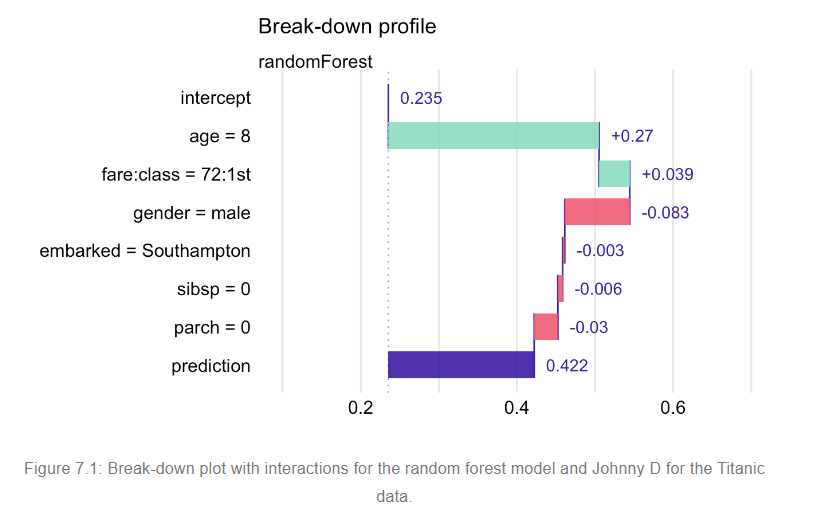
Table 7.3: Variable-Importance Measures
| Variable | \(j\) | \(v(j,\underline{x}_*)\) | \(v_0+\sum_{k=1}^j v(k,\underline{x}_*)\) |
|---|---|---|---|
| intercept (\(v_0\)) | 0.235 | ||
| age = 8 | 1 | 0.269 | 0.505 |
| fare:class = 72:1st | 2 | 0.039 | 0.544 |
| gender = male | 3 | -0.083 | 0.461 |
| embarked = Southampton | 4 | -0.002 | 0.458 |
| sibsp = 0 | 5 | -0.006 | 0.452 |
| parch = 0 | 6 | -0.030 | 0.422 |
Below is the break-down plot.