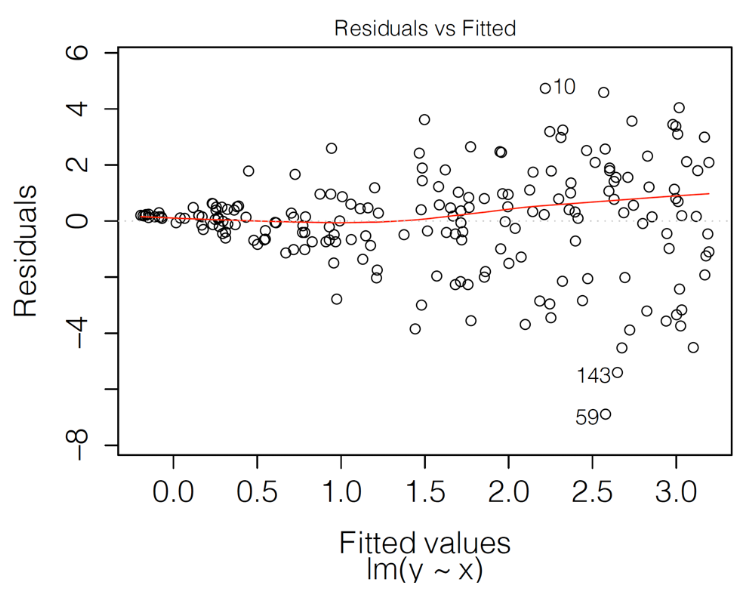
Residuals \(r_i\) in function of predicted values
The plot should show points scattered symmetrically around the horizontal straight line at 0, but:
It has got a shape of a funnel, reflecting increasing variability of residuals for increasing fitted values. The variance is not constant (homoscedasticity violation).
The smoothed line suggests that the mean of residuals becomes increasingly positive for increasing fitted values. The residuals don’t seems to have a zero-mean.