DALEX
ingredients
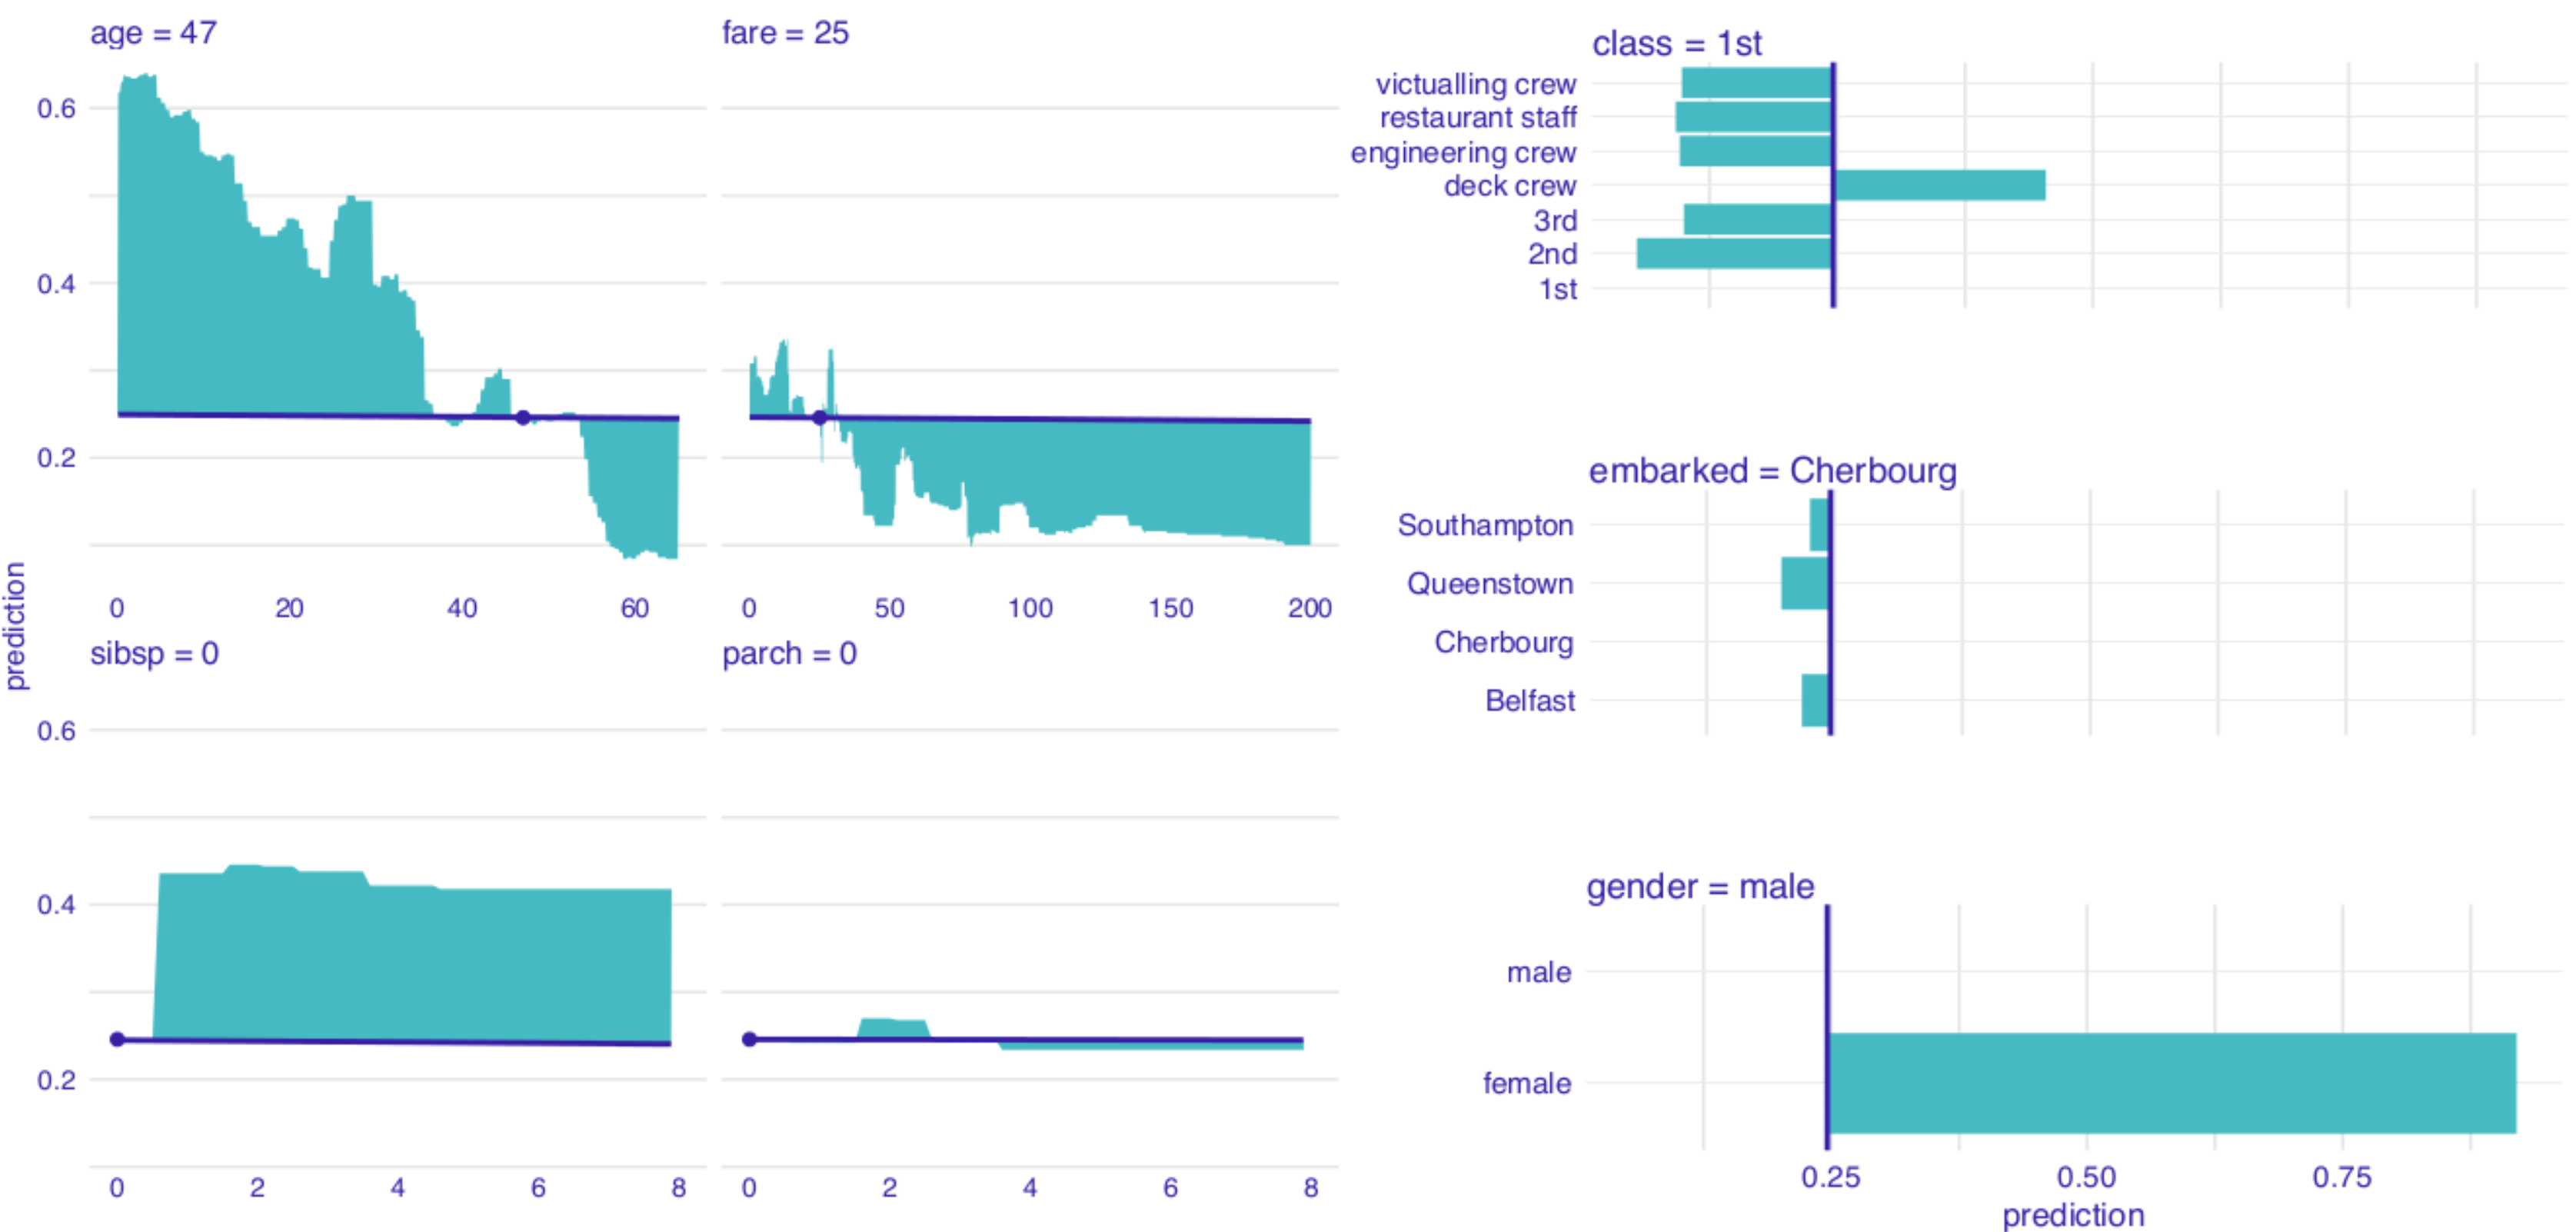
The sum of differences can be represented by the area between the profile and the line at prediction level.