10.2 Intuition
In essence, a CP profile shows the dependence of the conditional expectation of the dependent variable (response) on the values of the particular explanatory variable.
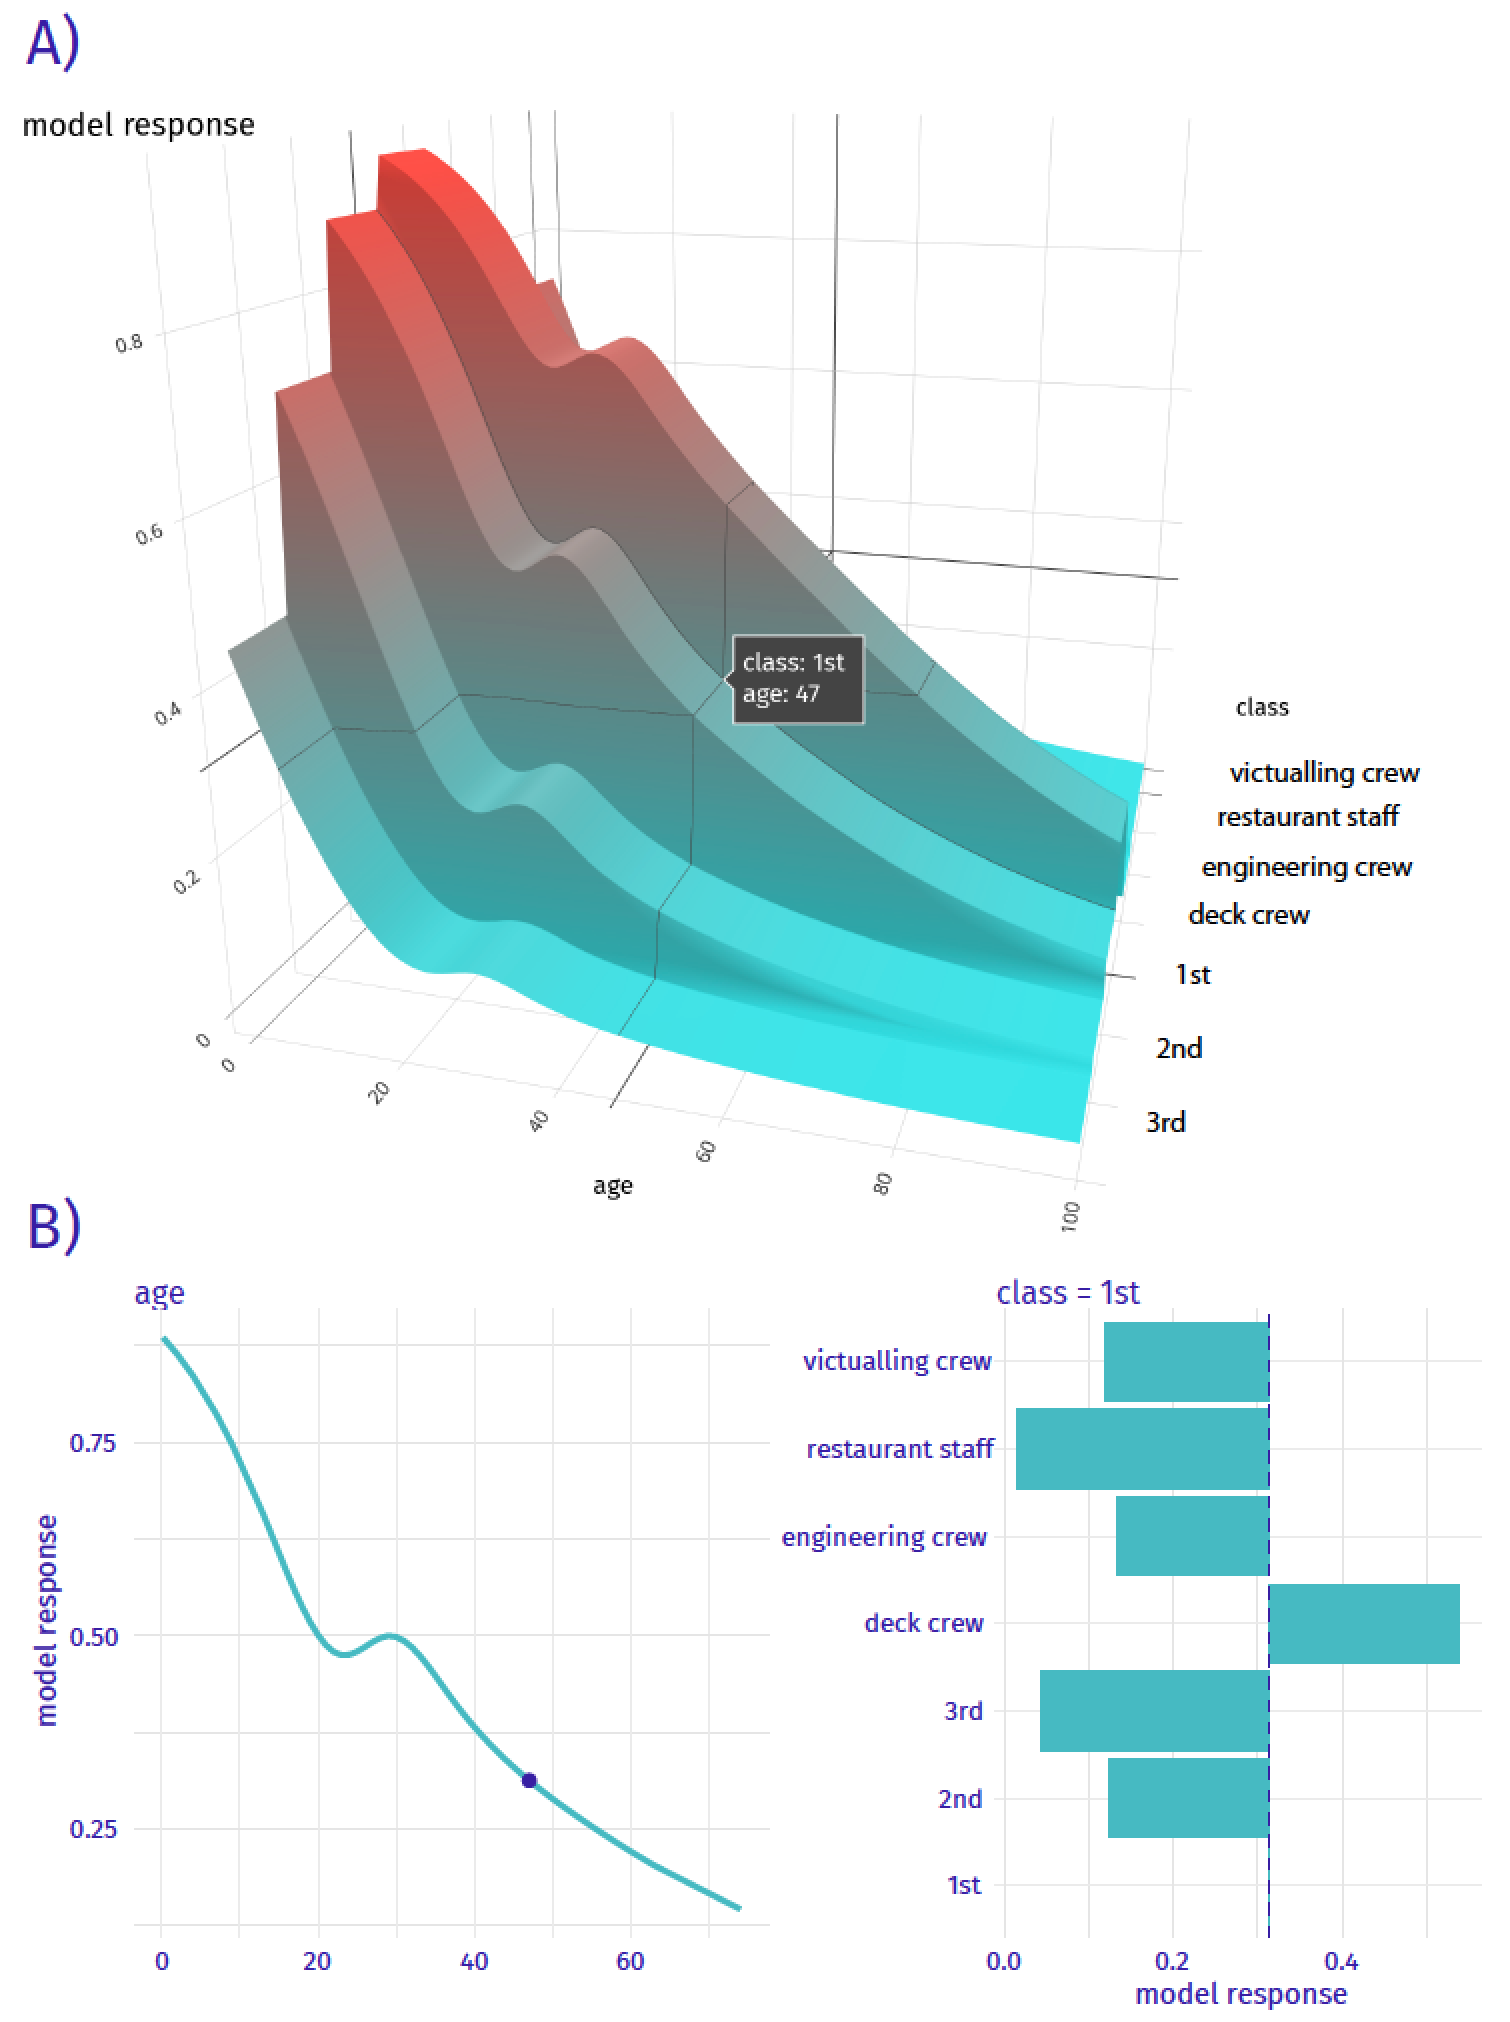
Figure 10.1 Panel A presents a 3D visualization, where \(x\) is the
age, \(y\) is the response (prediction probability), and \(z\) is theclassfactor for the ‘titanic_lmr’ logistic regression model.In the same figure, Panel B illustrates CP profiles for individual variables, age (continuous) and class (categorical).
Source: Figure 10.1