DALEX
ingredients
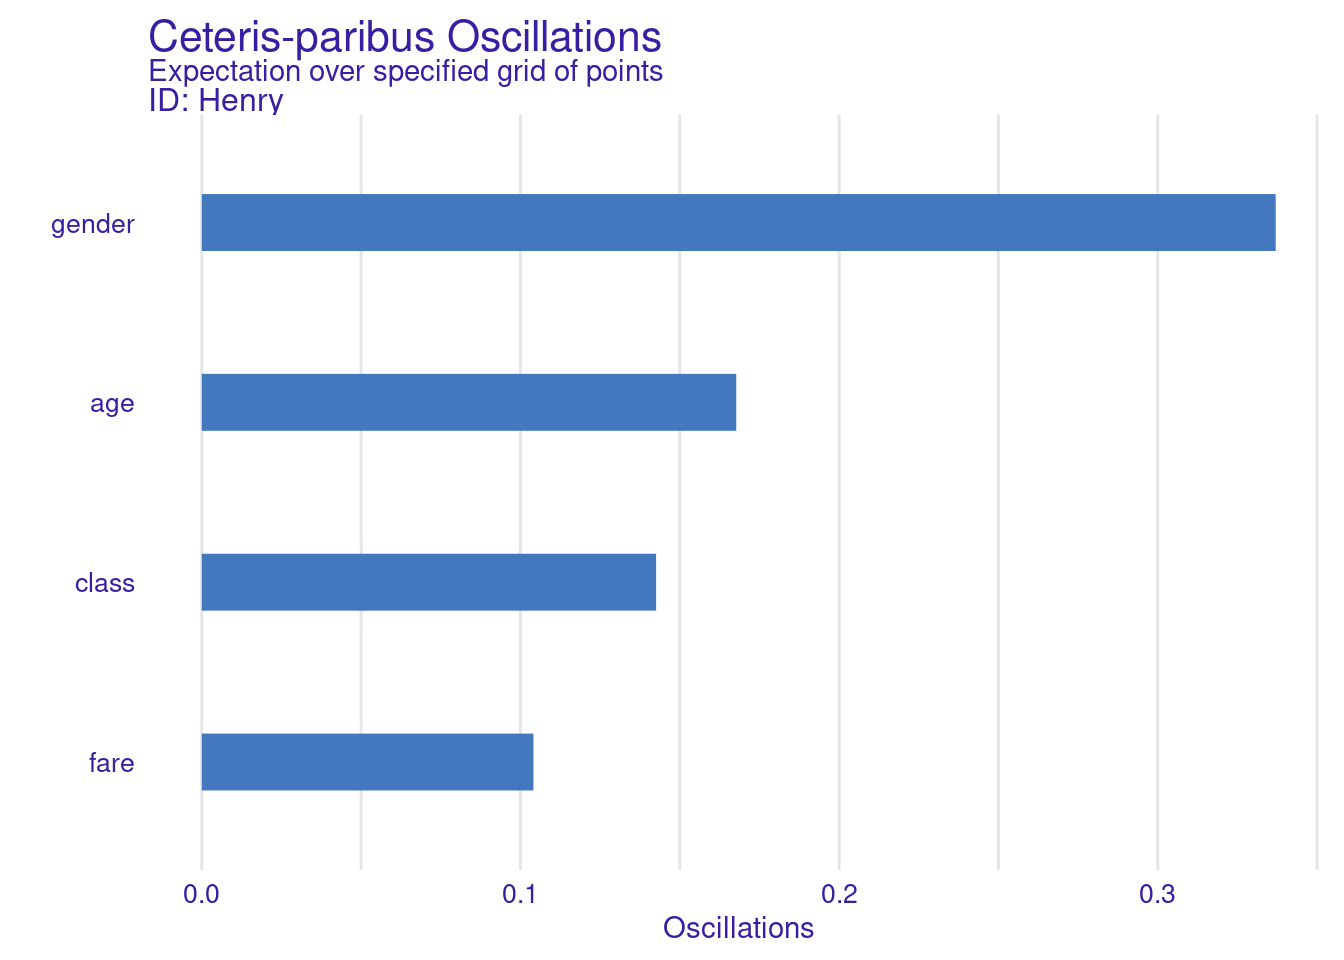
oscillations_equidist$`_ids_` <- "Henry"
plot(oscillations_equidist) +
  ggplot2::ggtitle("Ceteris-paribus Oscillations",
                   "Expectation over specified grid of points")