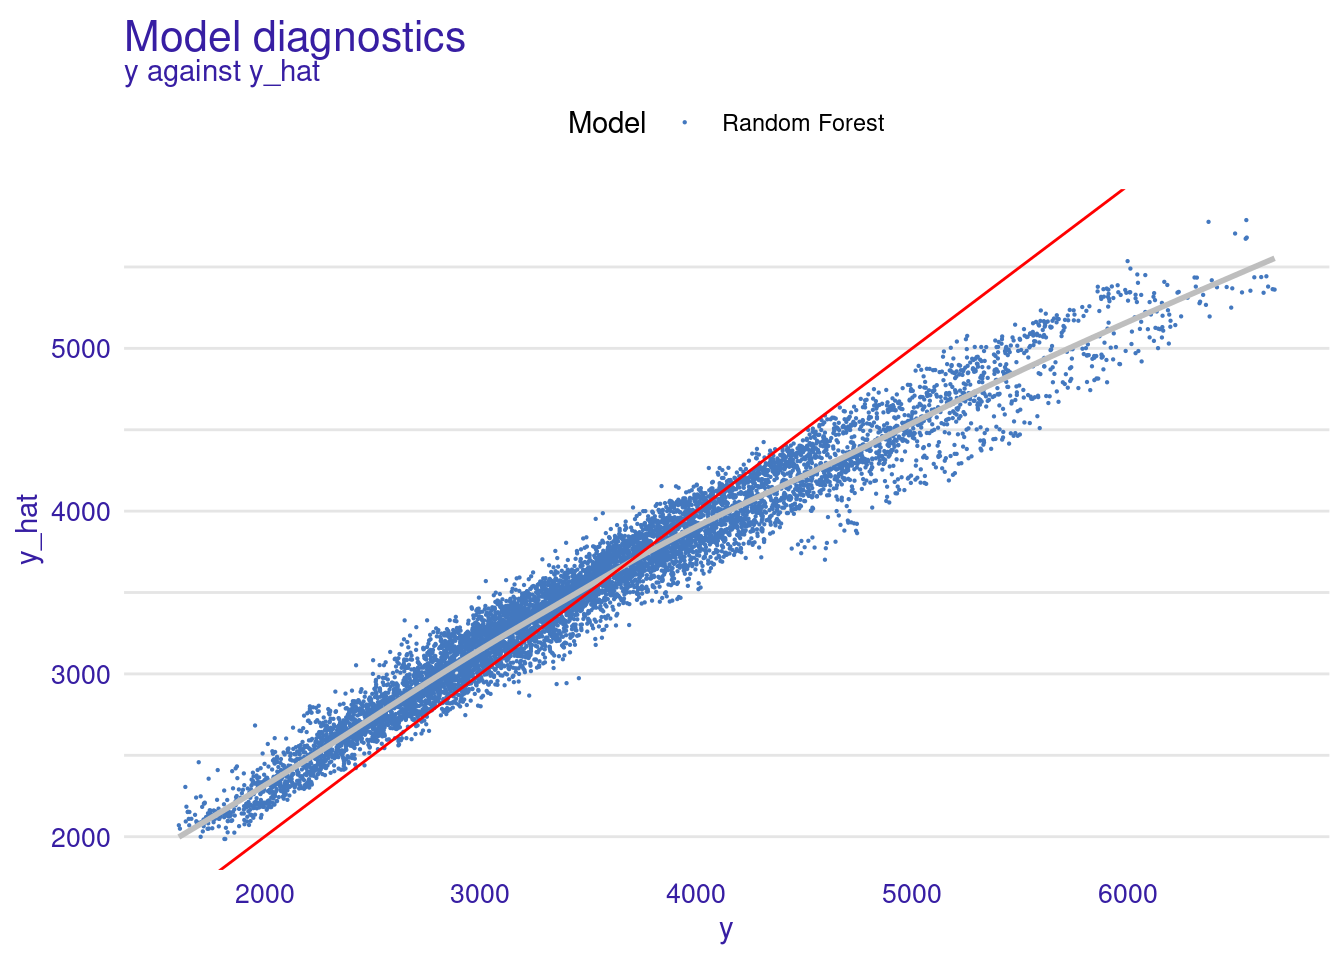
Random Forest: Predicted in function of observed values
The plot suggests that the predictions are shifted (biased) towards the average.
- For large observed the residuals are positive.
- For small observed the residuals are negative.
plot(md_rf, variable = "y", yvariable = "y_hat") +
  ggplot2::geom_abline(colour = "red", intercept = 0, slope = 1)
## `geom_smooth()` using method = 'gam' and formula = 'y ~ s(x, bs = "cs")'