6.5 R code examples
Load DALEX packages
Load Titanic imputed dataset.
##   gender age class    embarked  fare sibsp parch survived
## 1   male  42   3rd Southampton  7.11     0     0        0
## 2   male  13   3rd Southampton 20.05     0     2        0
## 3   male  16   3rd Southampton 20.05     1     1        0
## 4 female  39   3rd Southampton 20.05     1     1        1
## 5 female  16   3rd Southampton  7.13     0     0        1
## 6   male  25   3rd Southampton  7.13     0     0        1
Build a random forest model.
suppressMessages(library(randomForest))
model_titanic_rf <- randomForest(survived ~ gender + age + class + embarked +
                                   fare + sibsp + parch,  data = titanic_imputed,
                                 classification = TRUE)
## Warning in randomForest.default(m, y, ...): The response has five or fewer
## unique values. Are you sure you want to do regression?##
## Call:
## randomForest(formula = survived ~ gender + age + class + embarked + fare + sibsp + parch, data = titanic_imputed, classification = TRUE)
## Type of random forest: regression
## Number of trees: 500
## No. of variables tried at each split: 2
##
## Mean of squared residuals: 0.1402275
## % Var explained: 35.78Build an explainer object.
explain_titanic_rf <- explain(model_titanic_rf,
                                  data = titanic_imputed,
                                  y = titanic_imputed$survived,
                                  label = "Random Forest",
                                  colorize = FALSE)
## Preparation of a new explainer is initiated
## -> model label : Random Forest
## -> data : 2207 rows 8 cols
## -> target variable : 2207 values
## -> predict function : yhat.randomForest will be used ( default )
## -> predicted values : No value for predict function target column. ( default )
## -> model_info : package randomForest , ver. 4.7.1.1 , task regression ( default )
## -> predicted values : numerical, min = 0.007568155 , mean = 0.3223656 , max = 0.9933732
## -> residual function : difference between y and yhat ( default )
## -> residuals : numerical, min = -0.7815098 , mean = -0.0002088249 , max = 0.8965246
## A new explainer has been created!Create a dataframe for Johnny D passenger
new_passenger <- data.frame(
class = factor("1st", levels = c("1st", "2nd", "3rd", "deck crew", "engineering crew", "restaurant staff", "victualling crew")),
gender = factor("male", levels = c("female", "male")),
age = 8,
sibsp = 0,
parch = 0,
fare = 72,
embarked = factor("Southampton", levels = c("Belfast", "Cherbourg", "Queenstown", "Southampton"))
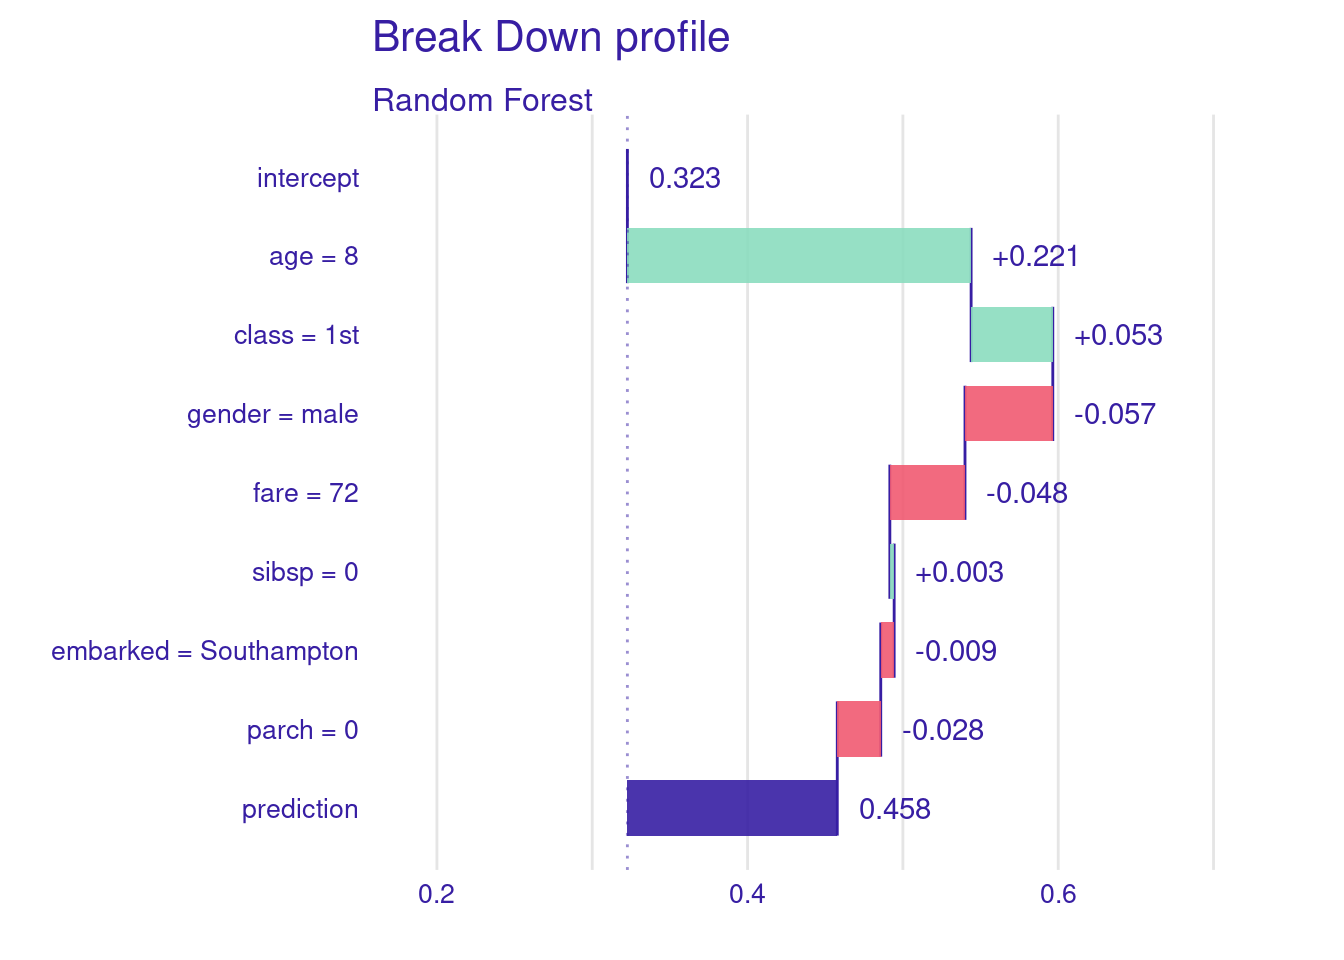
)Decompose model prediction with predict_parts()
##                                       contribution
## Random Forest: intercept                     0.322
## Random Forest: age = 8                       0.210
## Random Forest: class = 1st                   0.057
## Random Forest: gender = male                -0.058
## Random Forest: fare = 72                    -0.060
## Random Forest: sibsp = 0                     0.001
## Random Forest: embarked = Southampton       -0.005
## Random Forest: parch = 0                    -0.028
## Random Forest: prediction                    0.440
BD plot
order argument
bd_rf_order <- predict_parts(explainer = explain_titanic_rf,
                       new_observation = new_passenger,
                                  type = "break_down",
                   order = c("class", "age", "gender", "fare",
                             "parch", "sibsp", "embarked"))

plot(bd_rf_order, max_features = 3)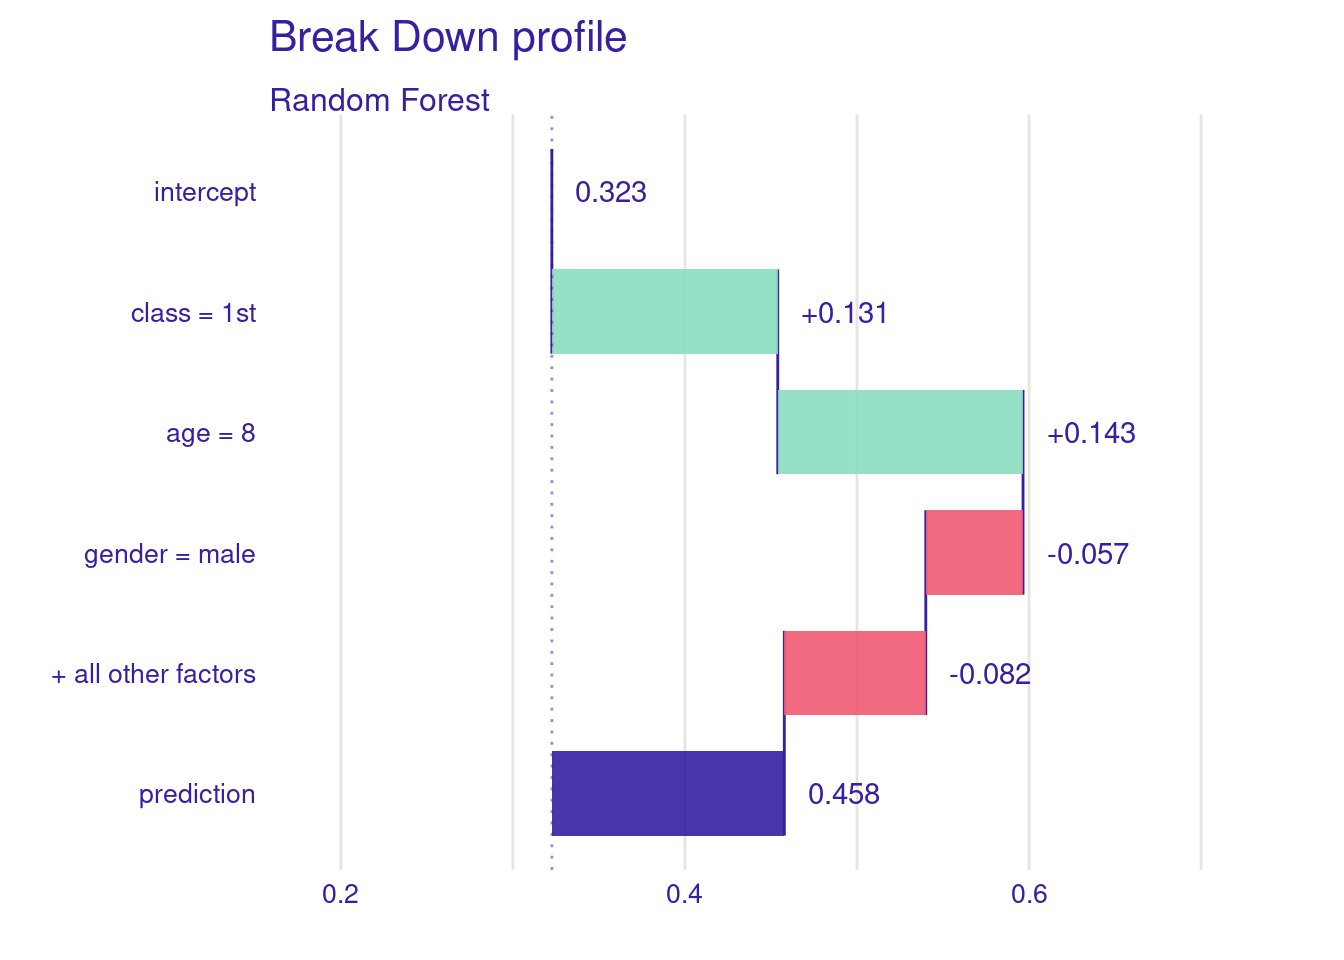
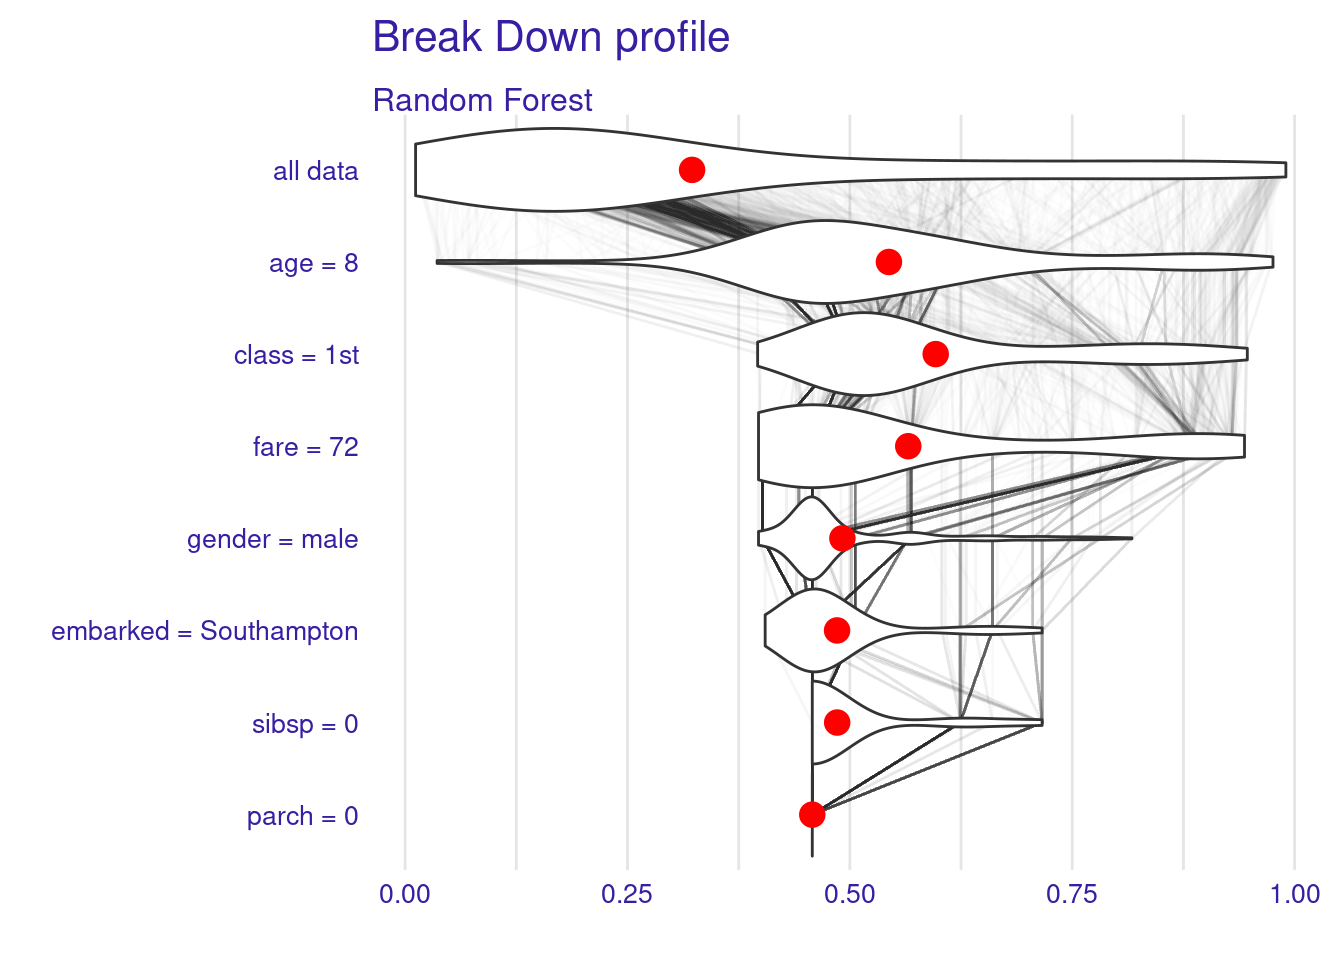
keep_distributions argument
bd_rf_distr <- predict_parts(explainer = explain_titanic_rf,
                       new_observation = new_passenger,
                                  type = "break_down",
              order = c("age", "class", "fare", "gender",
                        "embarked", "sibsp", "parch"),
                    keep_distributions = TRUE)

plot(bd_rf_distr, plot_distributions = TRUE)
## Warning: The `fun.y` argument of `stat_summary()` is deprecated as of ggplot2 3.3.0.
## ℹ Please use the `fun` argument instead.
## ℹ The deprecated feature was likely used in the iBreakDown package.
## Please report the issue at
## <https://github.com/ModelOriented/iBreakDown/issues>.
## This warning is displayed once every 8 hours.
## Call `lifecycle::last_lifecycle_warnings()` to see where this warning was
## generated.