Code Snippets in R
We use the titanic dataset and a random forest model.
library("DALEX")
library("randomForest")
titanic_imputed <- archivist::aread("pbiecek/models/27e5c")
titanic_rf <- archivist::aread("pbiecek/models/4e0fc")
explainer_rf <- DALEX::explain(model = titanic_rf,
                               data = titanic_imputed[, -9],
                               y = titanic_imputed$survived,
                               label = "Random Forest")
Partial-dependence profiles
library("ggplot2")
pdp_rf <- model_profile(explainer = explainer_rf, variables = "age")
plot(pdp_rf) + ggtitle("Partial-dependence profile for age") 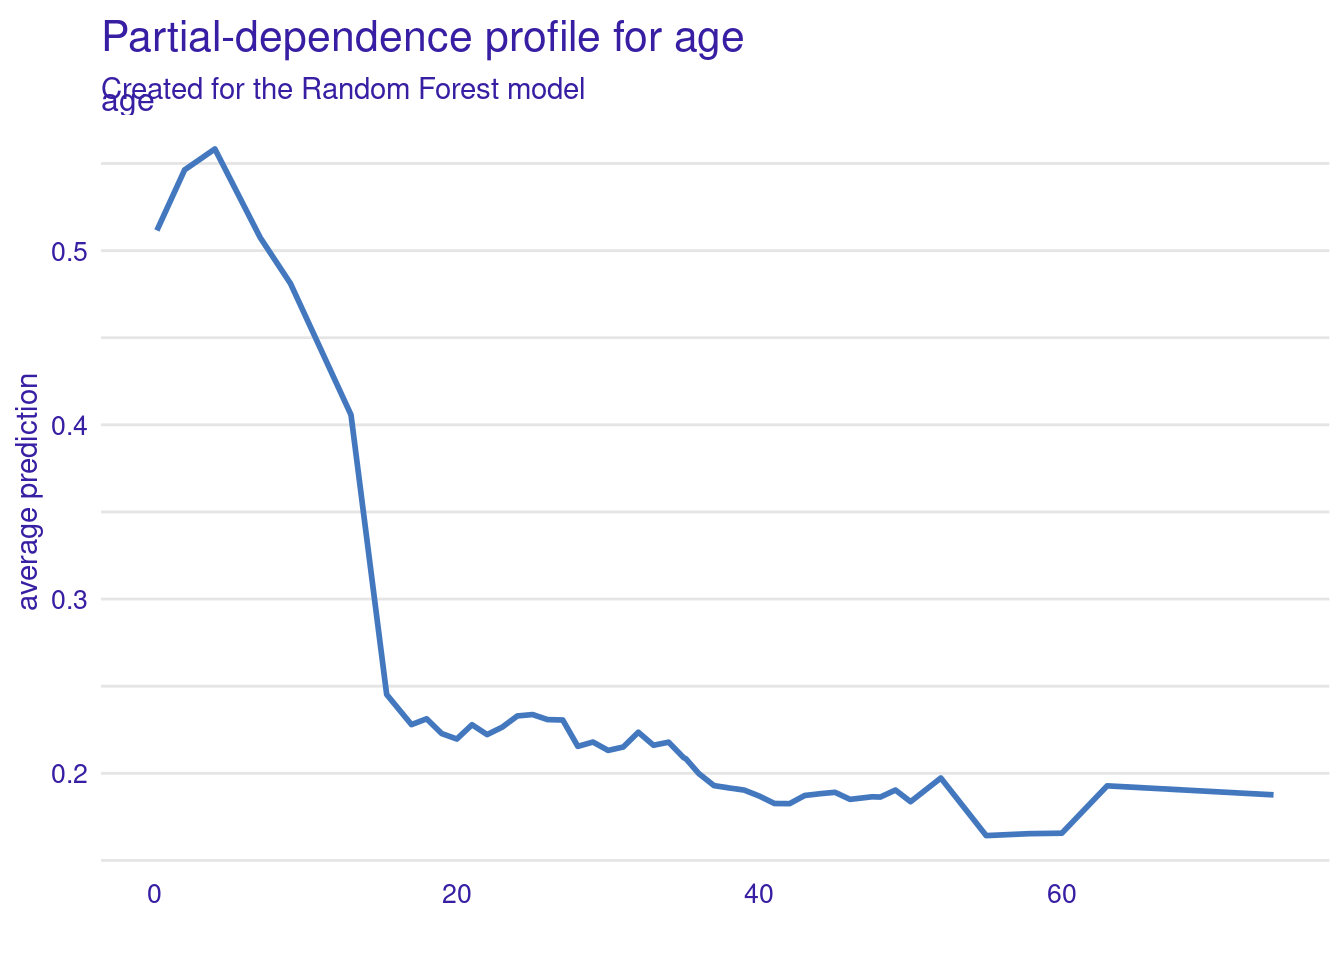
- Only need to supplier explainer and variable arguments
- Optional argument
Nallows you to vary the sample size used for calculation, default is 100 - We can specify specific grouping variables if creating grouped PDP
- We can also create clustered PDP by specifying the
kargument for number of clusters. Uses hierarchical clustering under the hood.
We can include CP profiles (i.e. an ICE plot) with an additional argument to plot():
plot(pdp_rf, geom = "profiles") +
ggtitle("Ceteris-paribus and partial-dependence profiles for age") 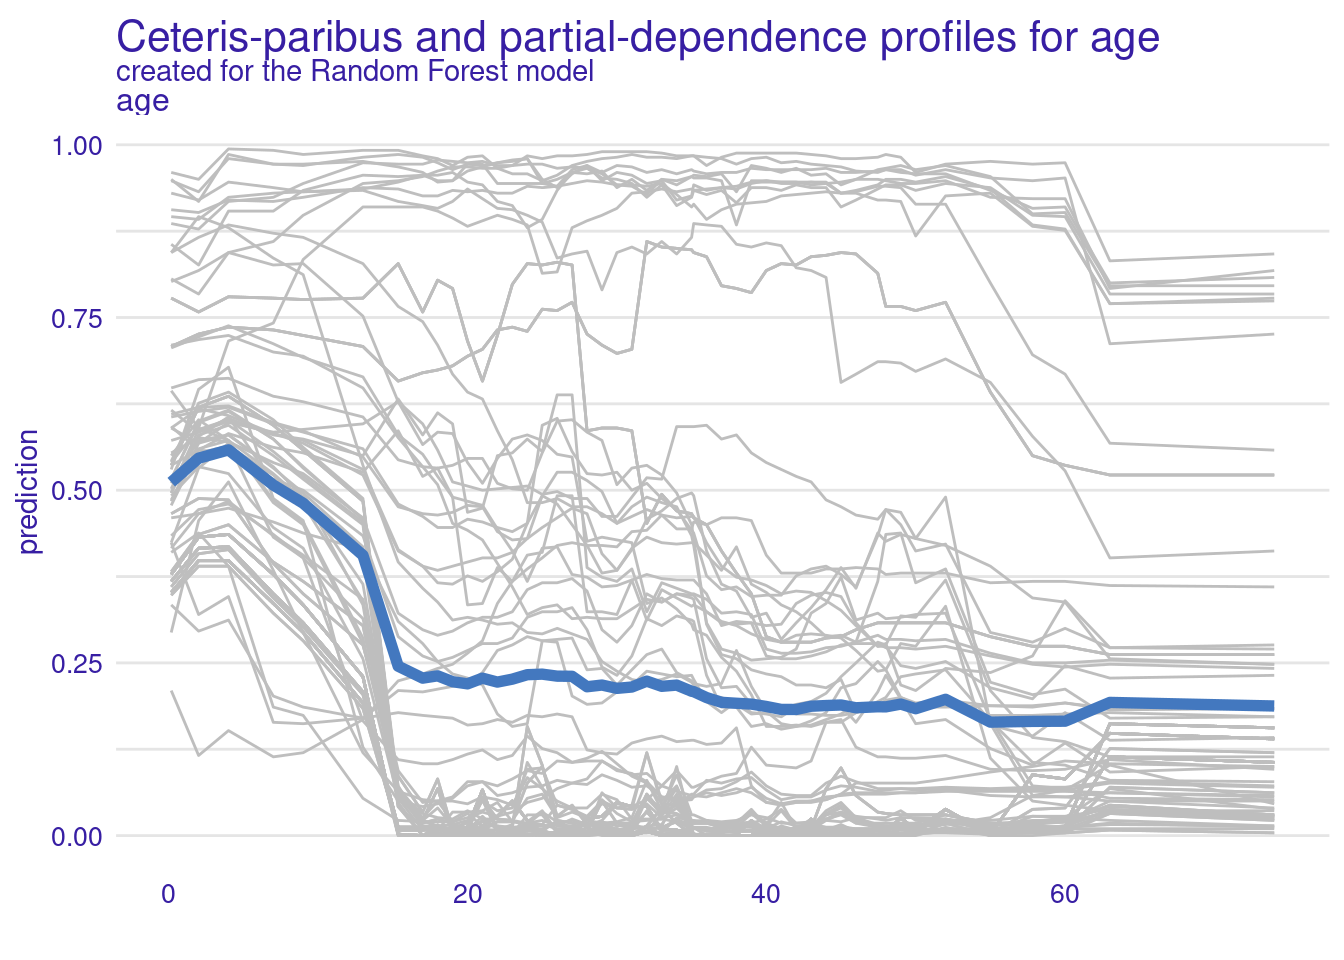
Clustered partial-dependence profiles
This uses hclust() function:
pdp_rf_clust <- model_profile(explainer = explainer_rf,
                              variables = "age", k = 3)

plot(pdp_rf_clust, geom = "profiles") +
    ggtitle("Clustered partial-dependence profiles for age")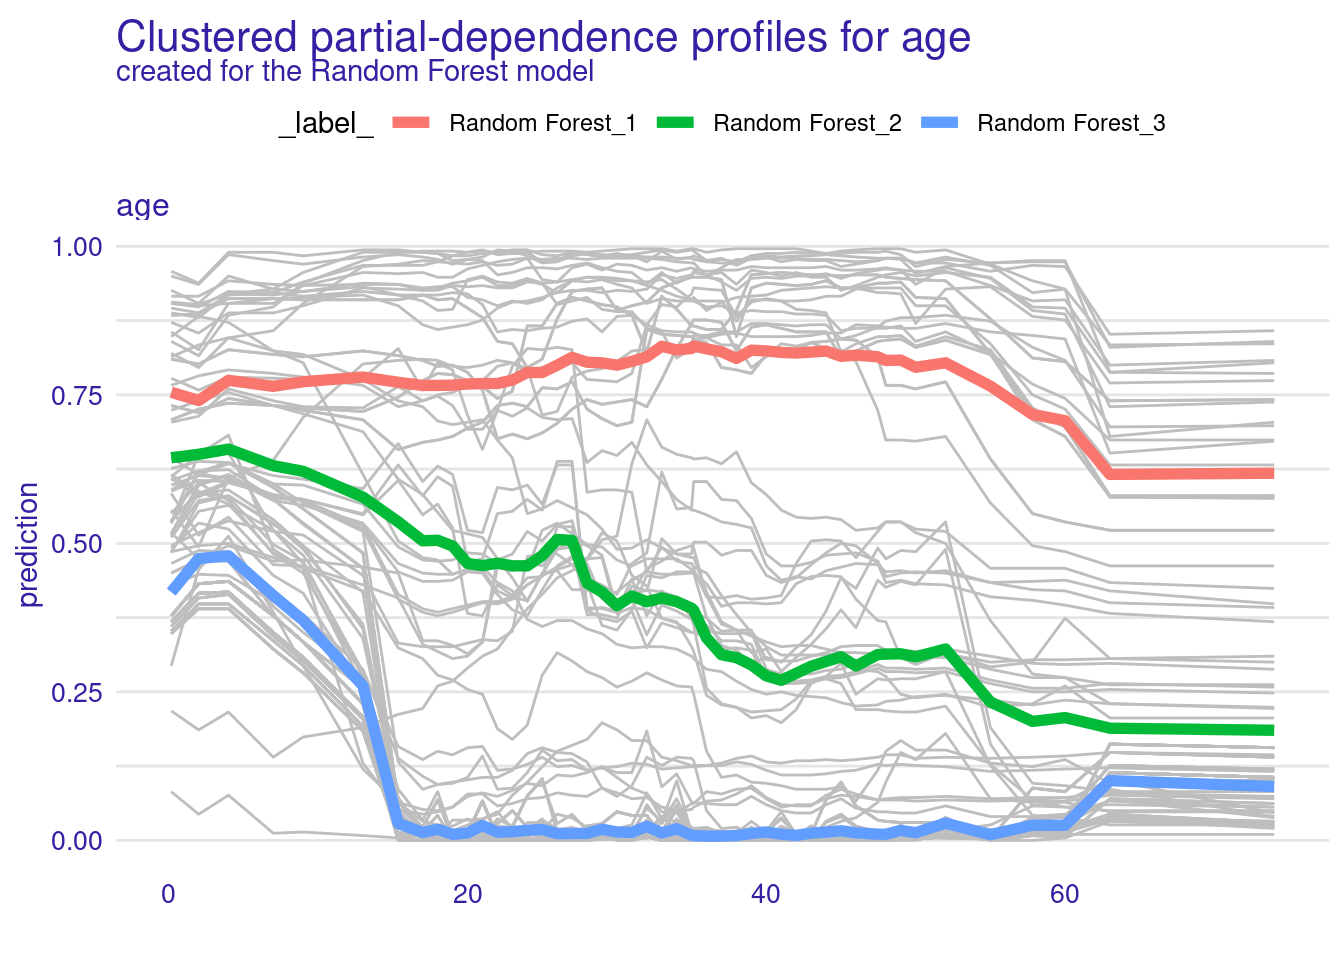
Grouped partial dependence profiles {-}
Below we group by gender:
pdp_rf_gender <- model_profile(explainer = explainer_rf,
                               variables = "age", groups = "gender")

plot(pdp_rf_gender, geom = "profiles") +
ggtitle("Partial-dependence profiles for age, grouped by gender") 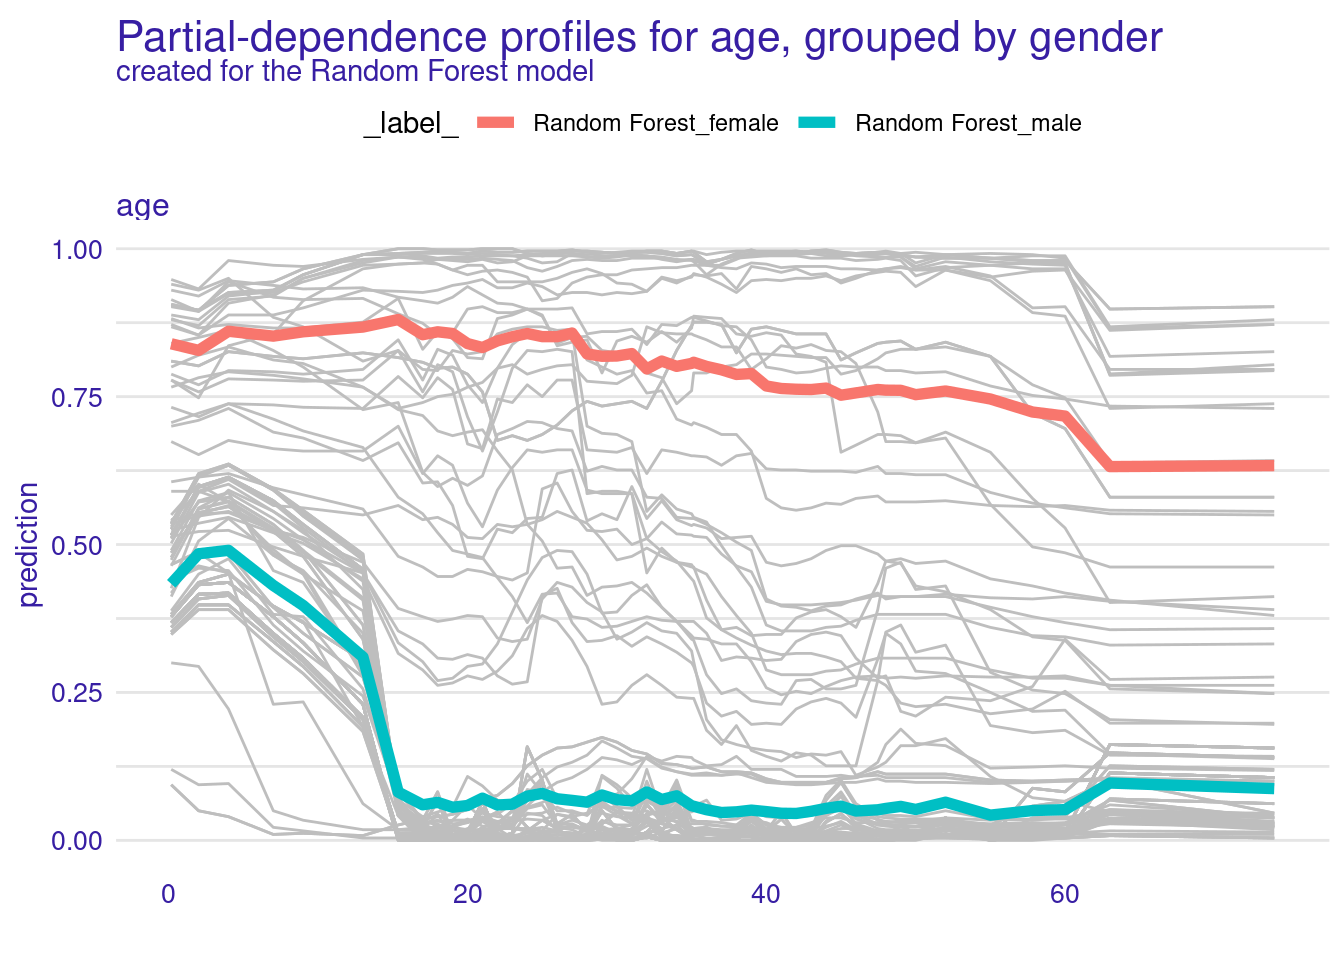
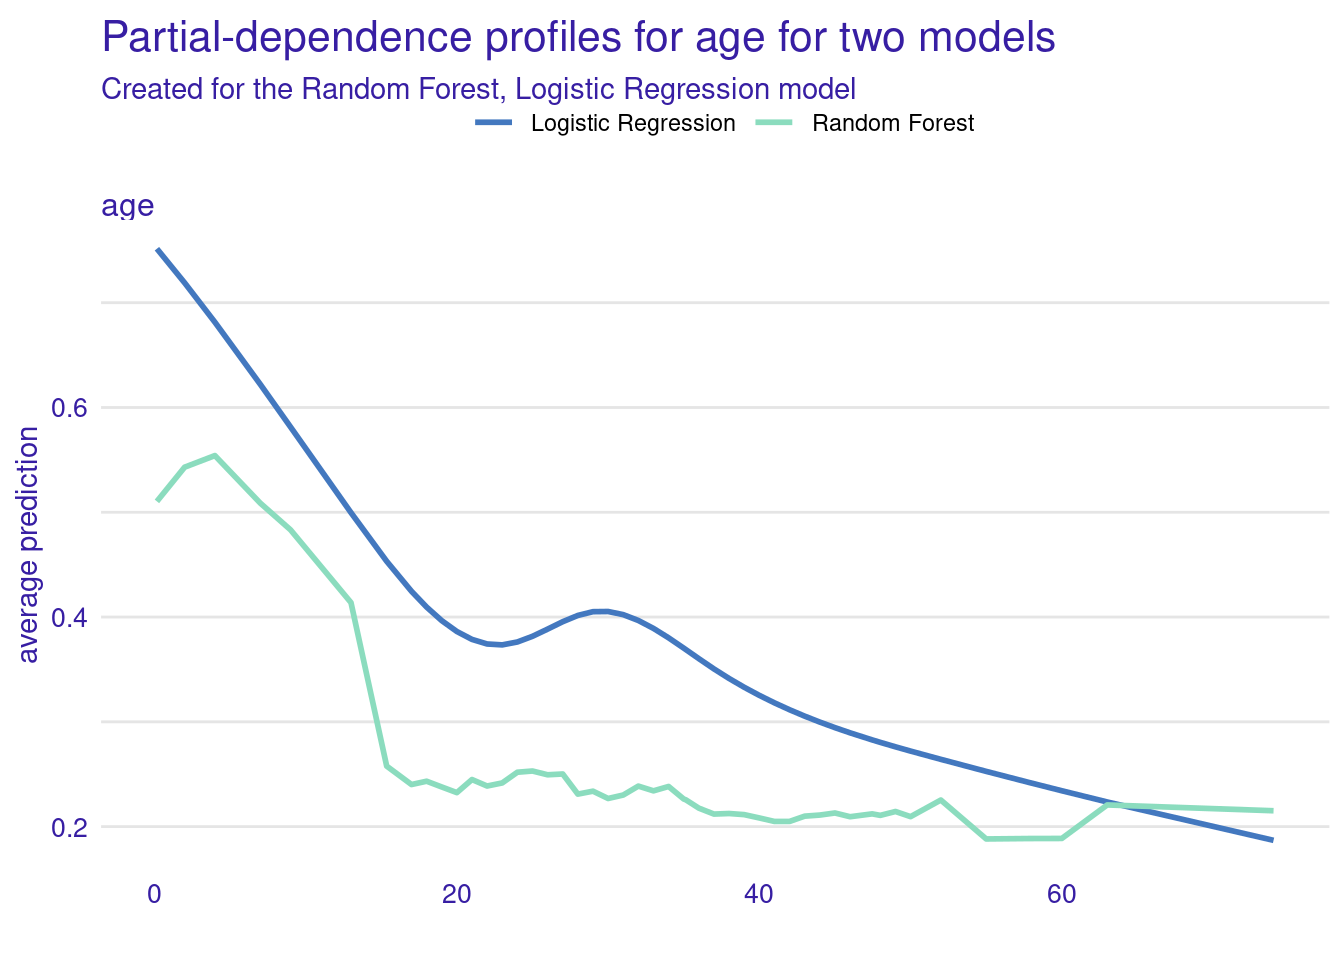
Contrastive partial-dependence profiles
library("rms")
titanic_lmr <- archivist::aread("pbiecek/models/58b24")
explainer_lmr <- DALEX::explain(model = titanic_lmr,
                                data = titanic_imputed[, -9],
                                y = titanic_imputed$survived,
                                label = "Logistic Regression")

pdp_lmr <- model_profile(explainer = explainer_lmr, variables = "age")
pdp_rf <- model_profile(explainer = explainer_rf, variables = "age")

plot(pdp_rf, pdp_lmr) +
    ggtitle("Partial-dependence profiles for age for two models")