6.2 Intuition
Let’s we assume that prediction \(f(\underline{x})\) is an approximation of the expected value of the dependent variable \(Y\) given values of explanatory variables \(\underline{x}\).
So, the underlying idea of BD plots is to capture the contribution of an explanatory variable to the model’s prediction by computing the shift in the expected value of \(Y\), while fixing the values of other variables.
The figure below illustrates the prediction obtained for the random forest model for passenger Johnny D, an 8-year-old passenger travelling in the first class.
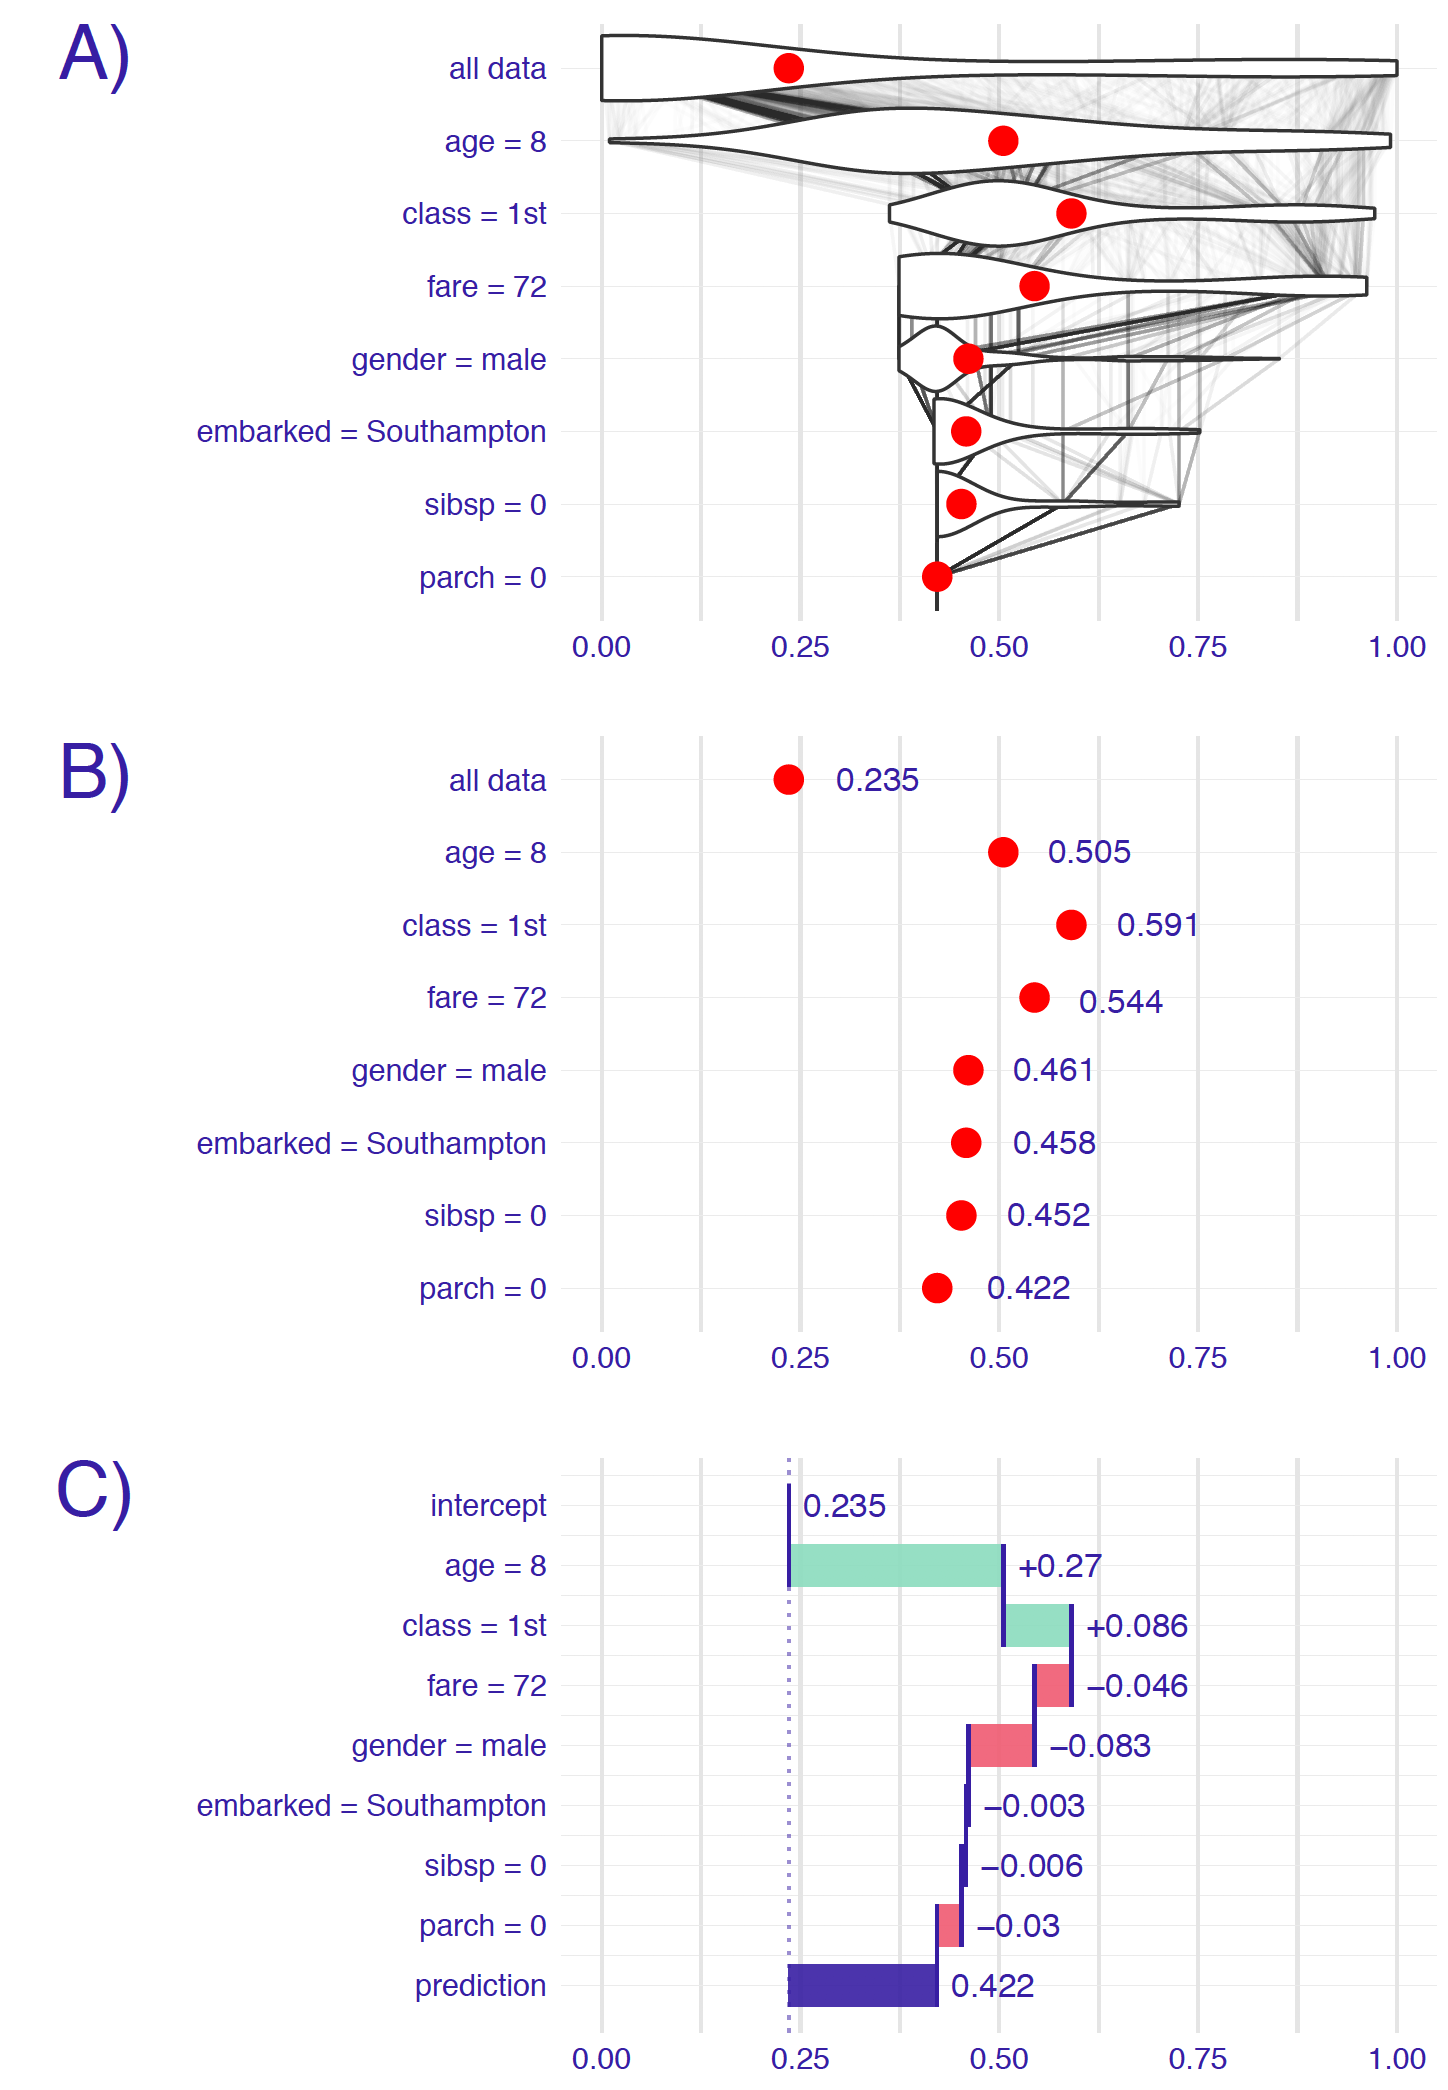
We can conclude that:
the mean prediction for the random forest model for the Titanic dataset is equal to 23.5%.
The model’s prediction for Johnny D is equal to 42.2%, which is much higher than the mean prediction.
The two explanatory variables that influence this prediction the most are age (with the value equal to 8) and class (with the value “1st”).
All other explanatory variables have smaller effects, and they actually reduce the increase in the predicted value induced by class and age.