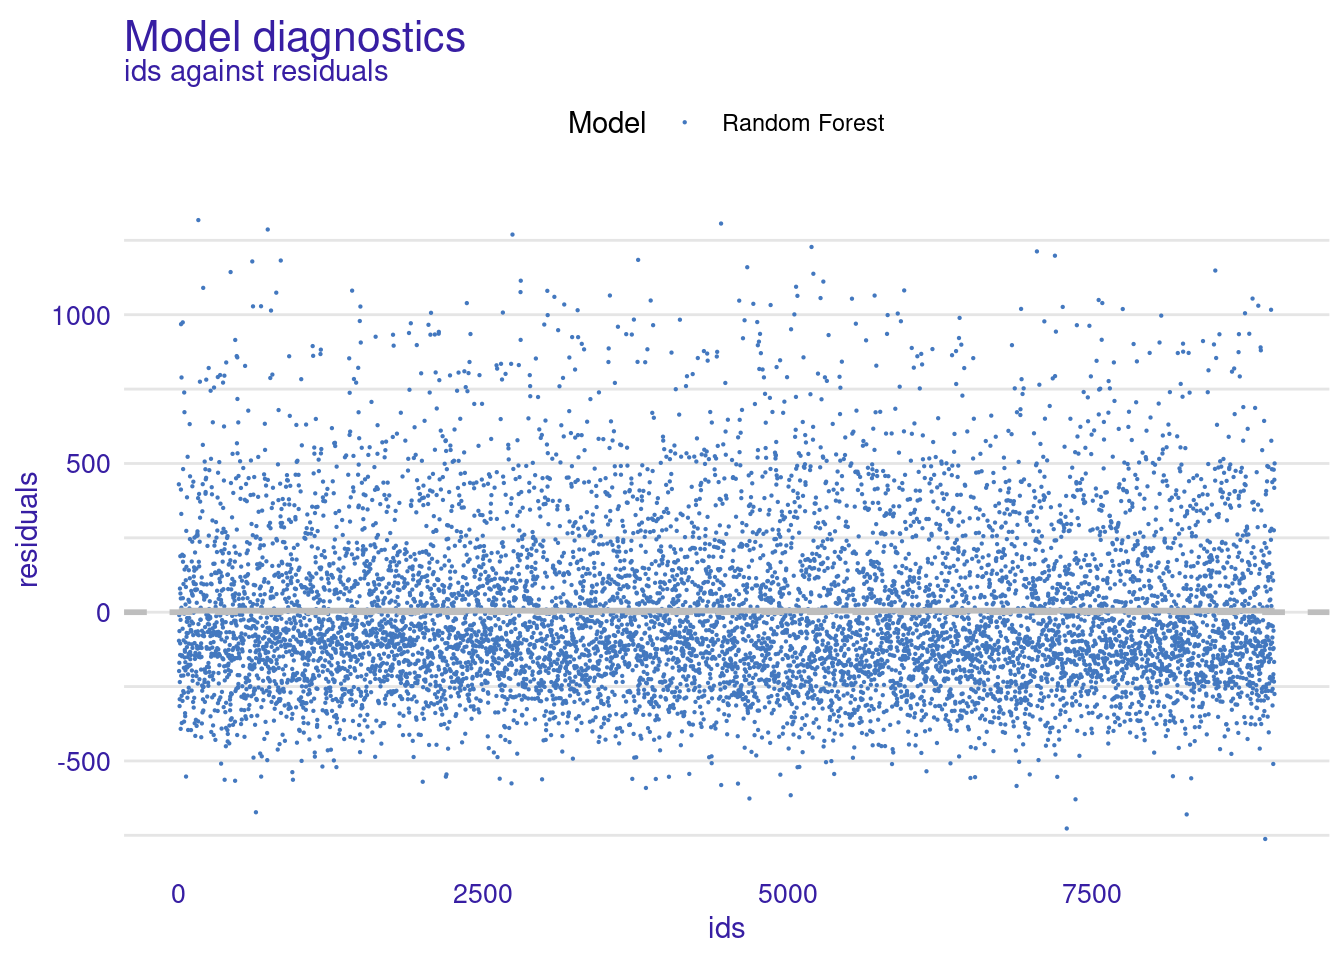
Random Forest: Residuals \(r_i\) in function of an (arbitrary) identifier of the observation
The plot indicates:
- An asymmetric distribution of residuals around zero
- An excess of large positive (larger than 500) residuals without a corresponding fraction of negative values.
## `geom_smooth()` using method = 'gam' and formula = 'y ~ s(x, bs = "cs")'