Data understanding
Target to Feature Relationships
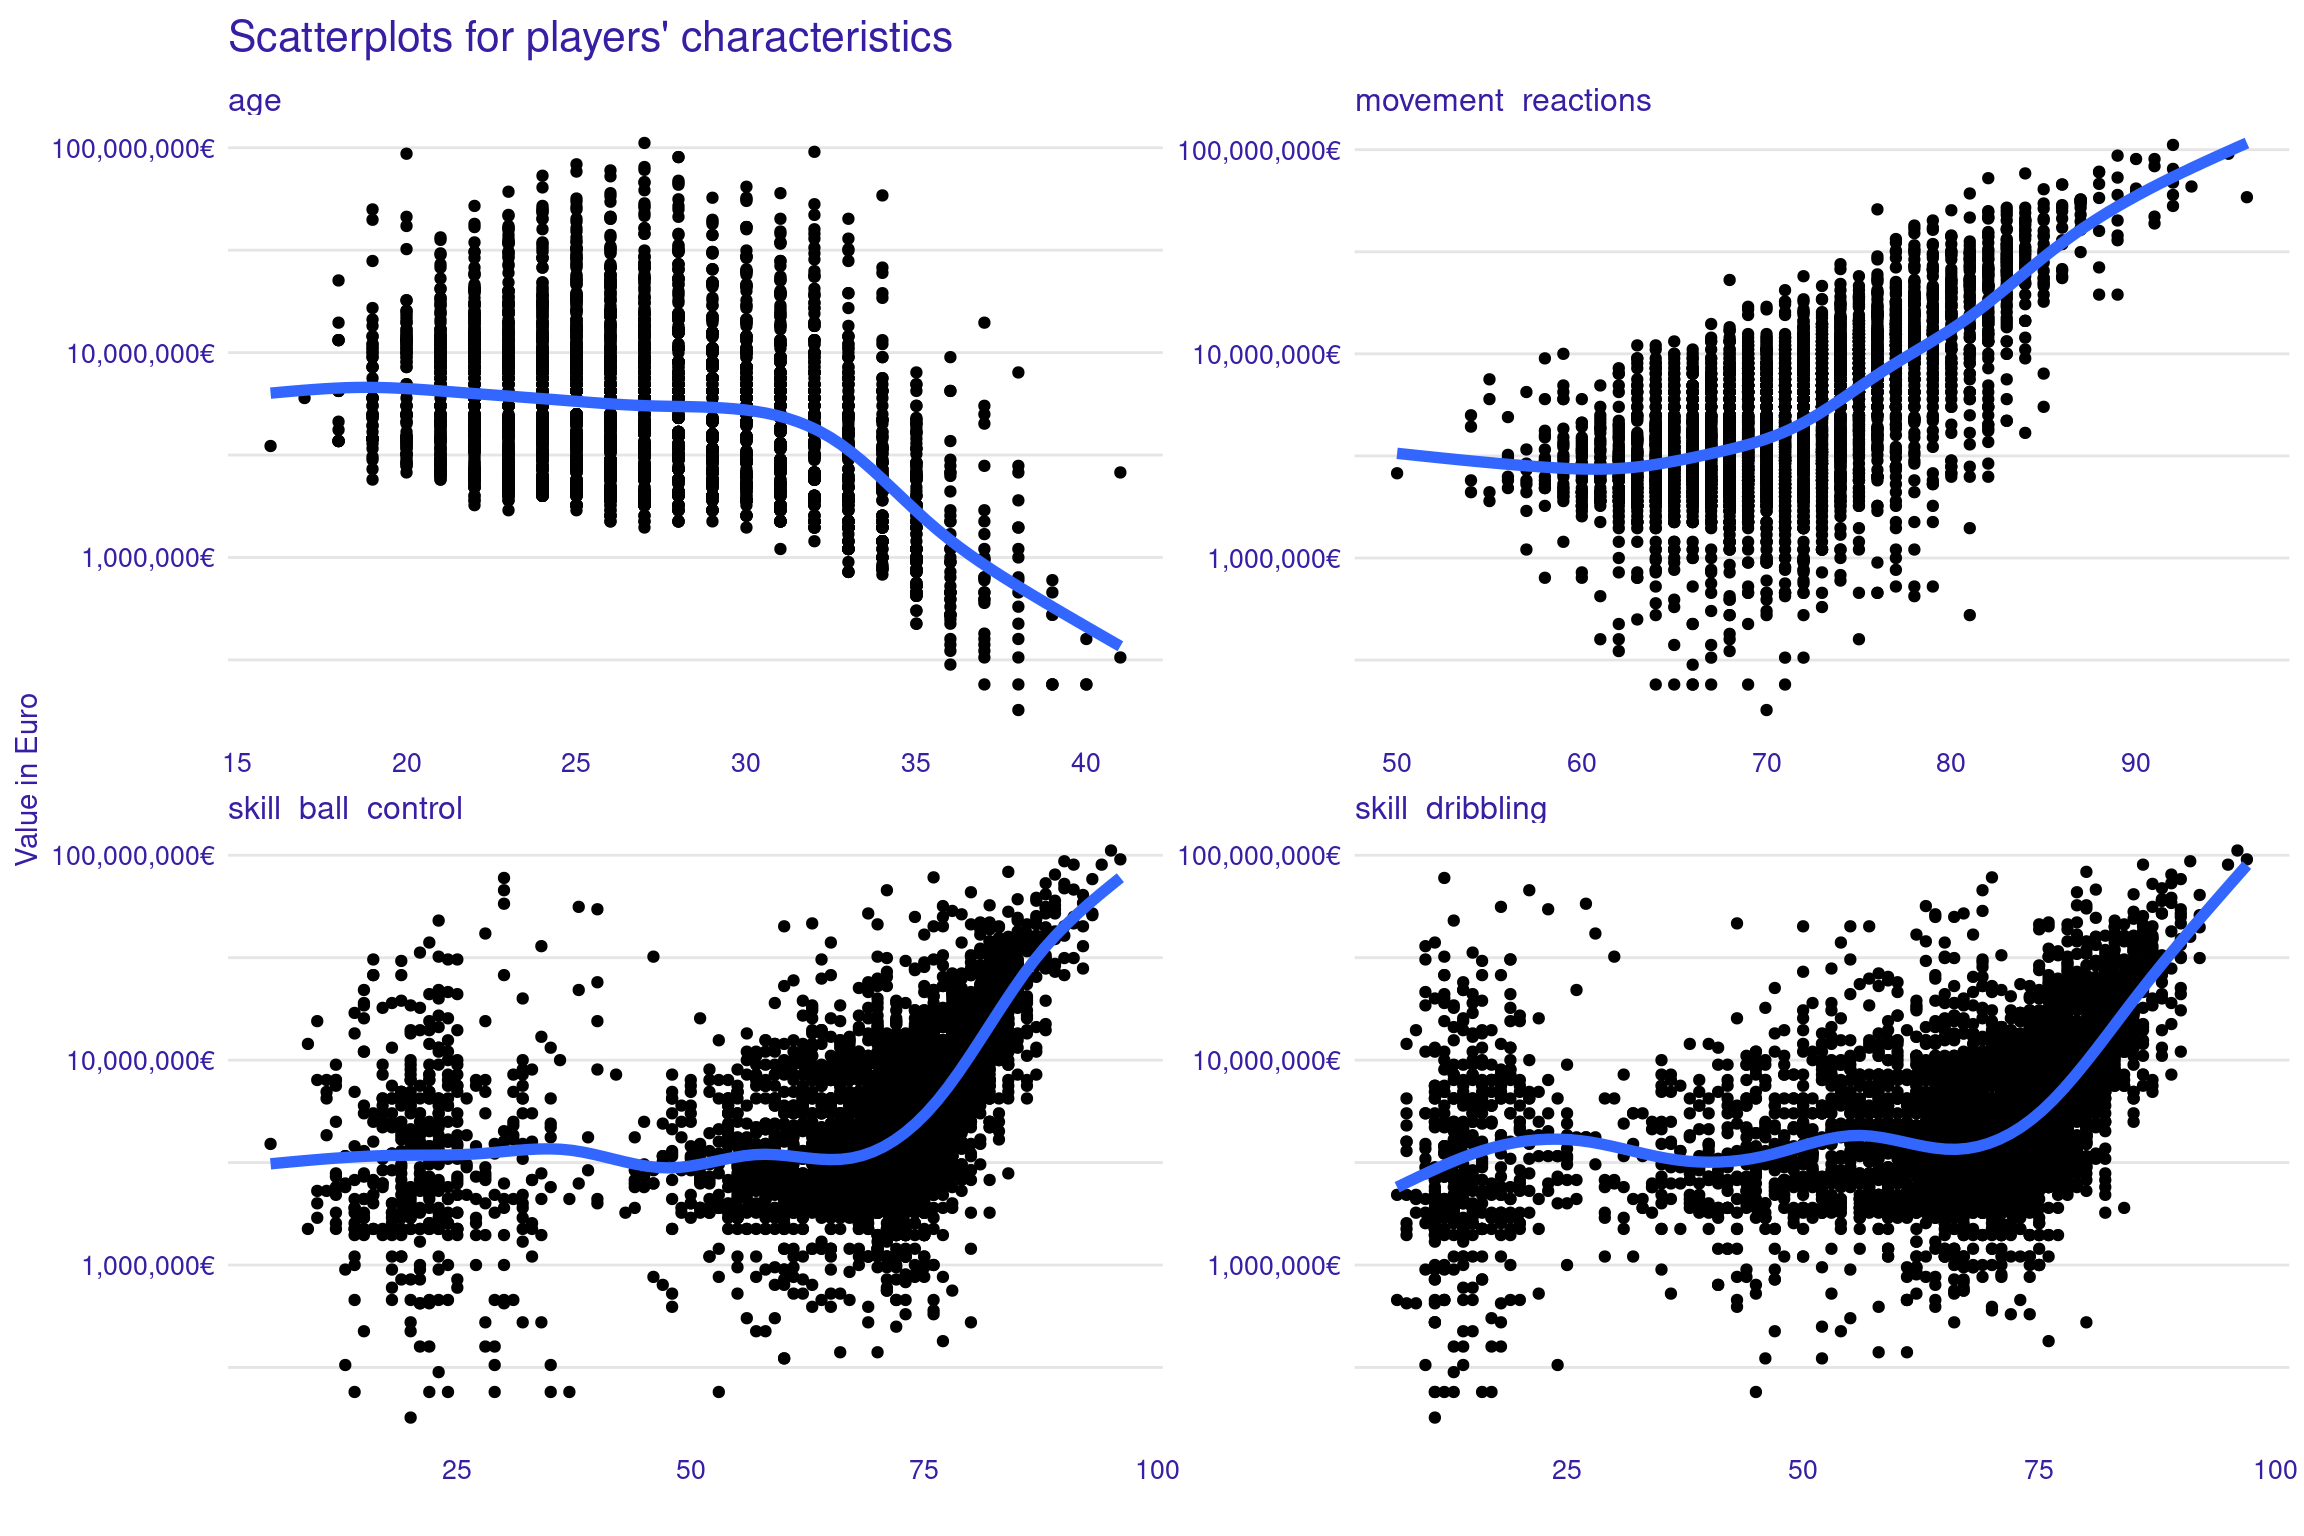
Let’s create bivariate plots to get a high-level understanding of the relationship between players’ value and our key explanatory variables. Note: player values are plotted on a \(log_{10}\) scale

Feature-Feature Relationships
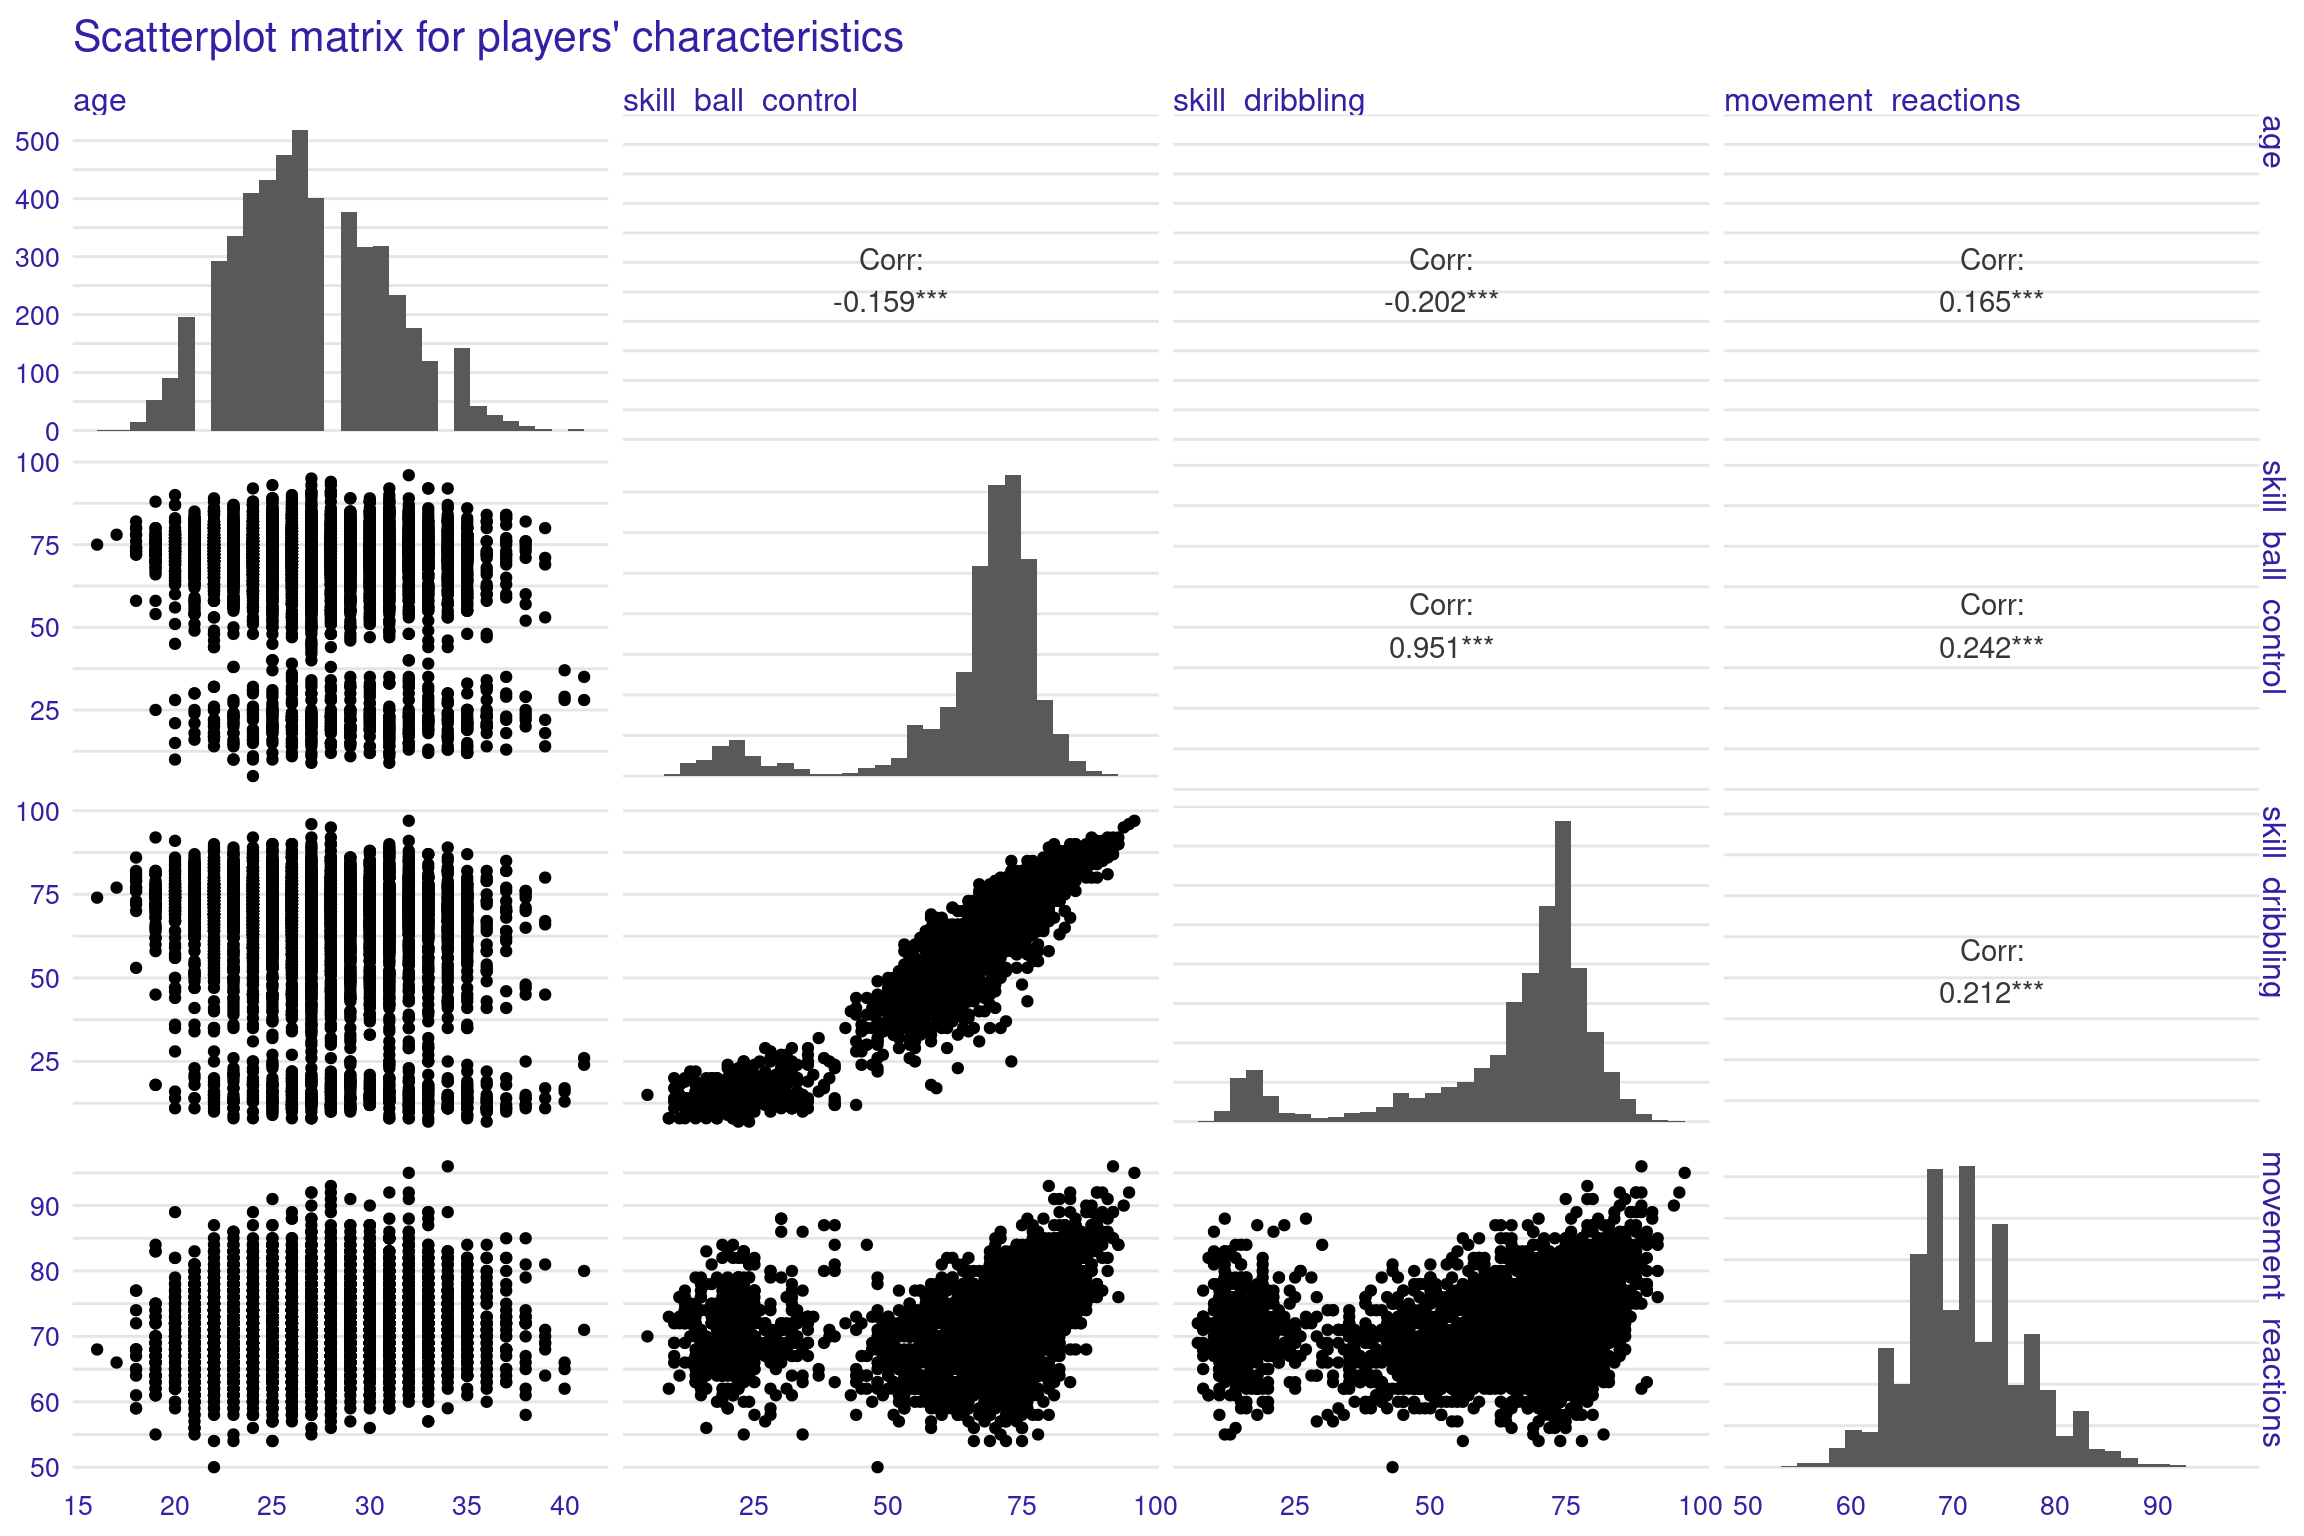
Now let’s examine the relationship between key explanatory variables.

Observations:
- Strong correlation between dribbling and ball control
- Moderate correlation between reactions and other variables
- Age shows very little correlation with ball control and dribbling