22.3 Interactive debugger
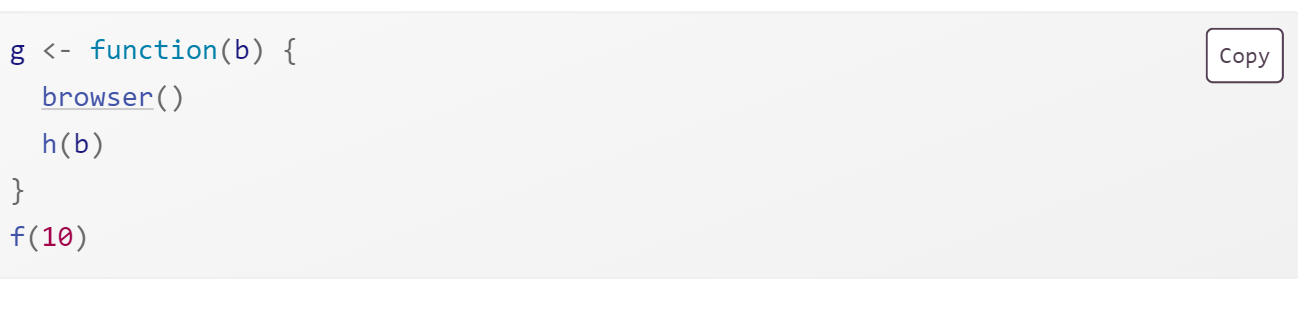
Sometimes, the precise location of the error is enough to let us to track it down and fix it. Frequently, however, we need more information, and the easiest way to get it is with the interactive debugger which allows you to pause execution of a function and interactively explore its state.

If you’re using RStudio, the easiest way to enter the interactive debugger is through RStudio’s “Rerun with Debug” tool. This reruns the command that created the error, pausing execution where the error occurred. Otherwise, you can insert a call to browser() where you want to pause, and re-run the function. For example, we could insert a call browser() in g():

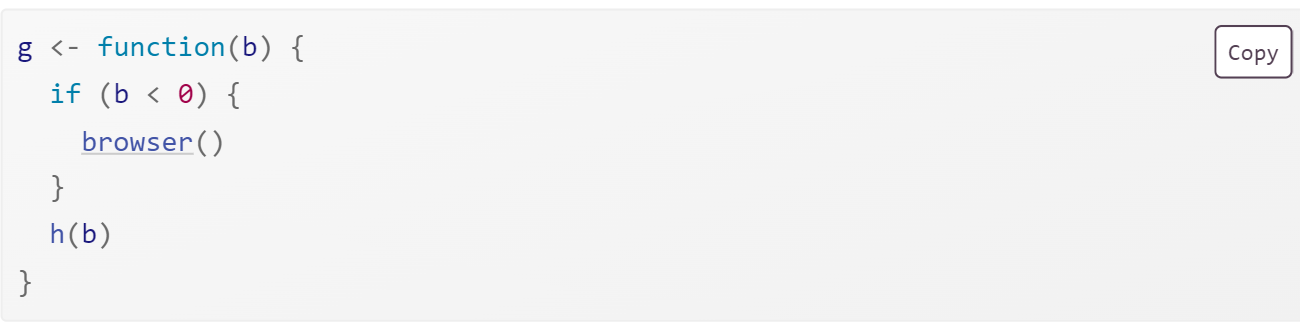
browser() is just a regular function call which means that you can run it conditionally by wrapping it in an if statement:

In either case, you’ll end up in an interactive environment inside the function where you can run arbitrary R code to explore the current state. You’ll know when you’re in the interactive debugger because you get a special prompt.

In RStudio, you’ll see the corresponding code in the editor (with the statement that will be run next highlighted), objects in the current environment in the Environment pane, and the call stack in the Traceback pane.